KROWN benchmark results#
This page records published KROWN benchmark campaigns. Each dated section fixes the configuration used for that execution and keeps its measurements separate from the benchmark guide.
4 August 2026#
This campaign measured all 58 scenarios in roundtrip mode with three iterations per scenario.
Setting |
Value |
|---|---|
KROWN revision |
|
Suites |
|
Forward engine |
RMLMapper 8.1.0 |
Inversion engine |
|
Sampling interval |
0.1 seconds |
Metric scope |
Whole system |
Operating system |
Debian GNU/Linux 12 (bookworm), Linux 6.1.0-44-amd64, x86-64 |
CPU |
29 vCPUs, AMD EPYC 7413 24-Core Processor |
Memory |
295 GiB RAM, no swap |
Benchmark storage |
4 TiB ext4 virtual disk |
PostgreSQL |
14.5 for forward materialization; 13 for inversion |
The raw results contain every completed iteration and recorded failure. The aggregated statistics contain per-scenario summaries and 95% confidence intervals.
Outcomes and resource limits#
Outcome |
Scenarios |
|---|---|
|
22 |
|
18 |
|
8 |
|
7 |
|
3 |
Forward materialization completed for 48 scenarios, and every completed graph was inverted and validated. No scenario that completed an RDF round trip produced a mismatch, and no scenario returned NON_INVERTIBLE. The eight FULL outcomes came from completed RawData scenarios, whose mappings expose every source column.
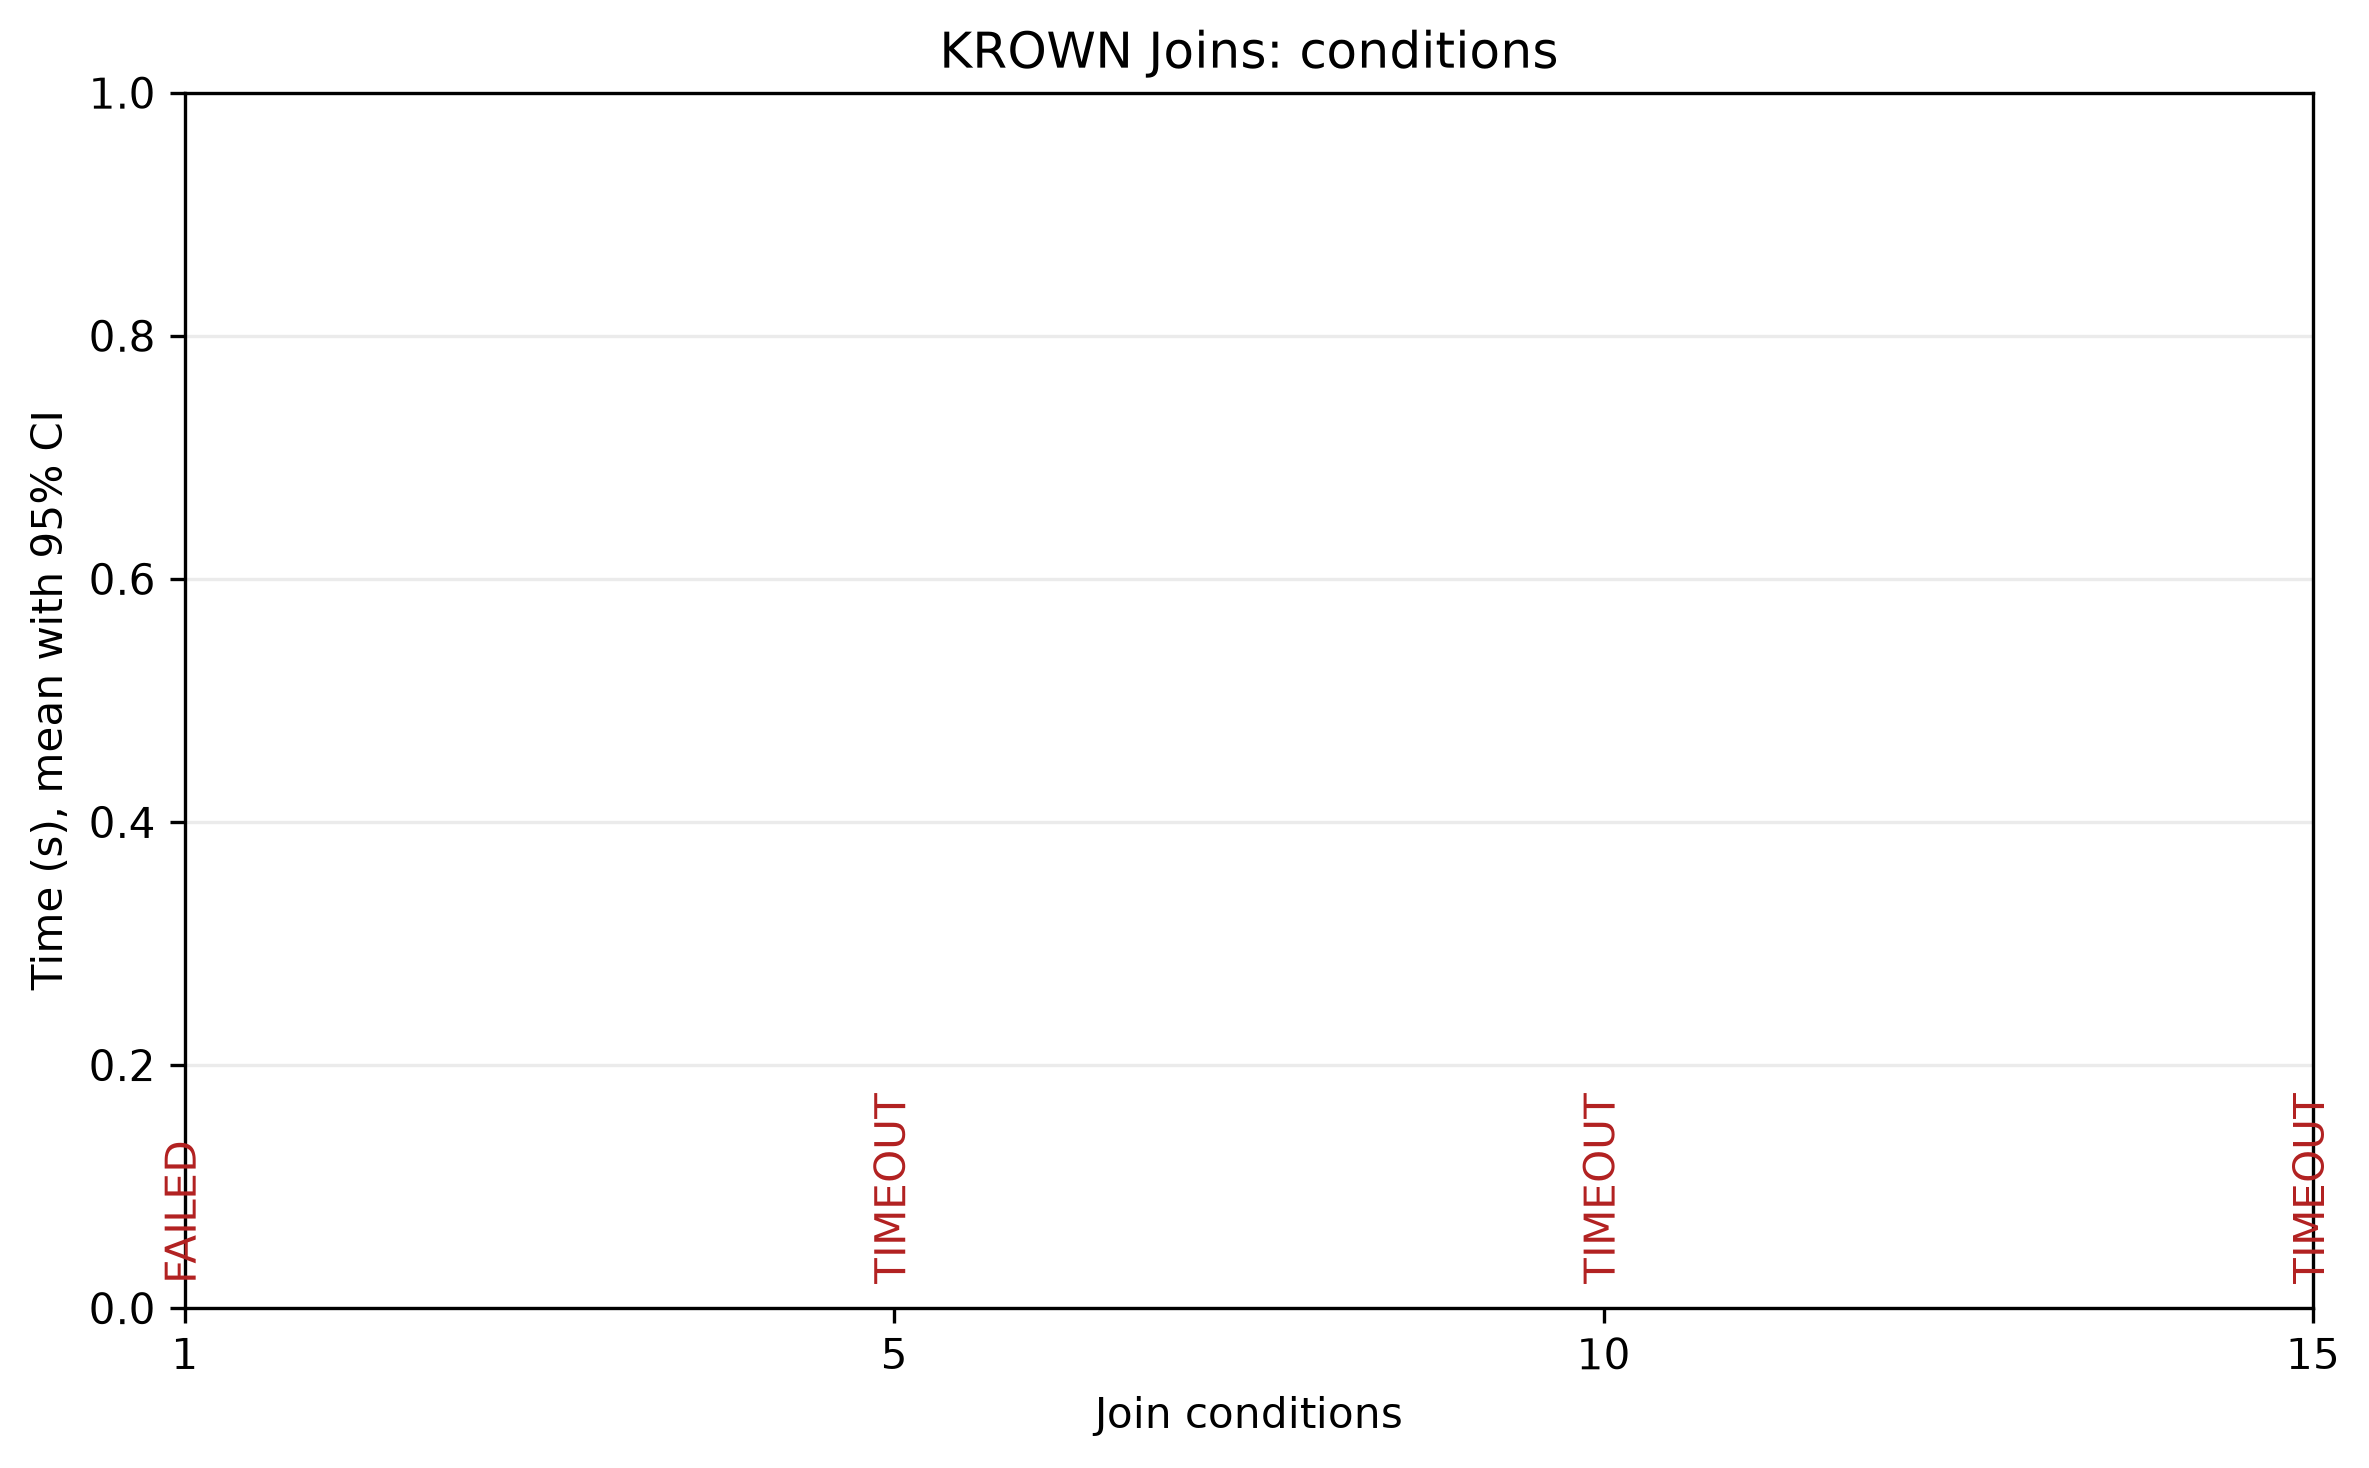
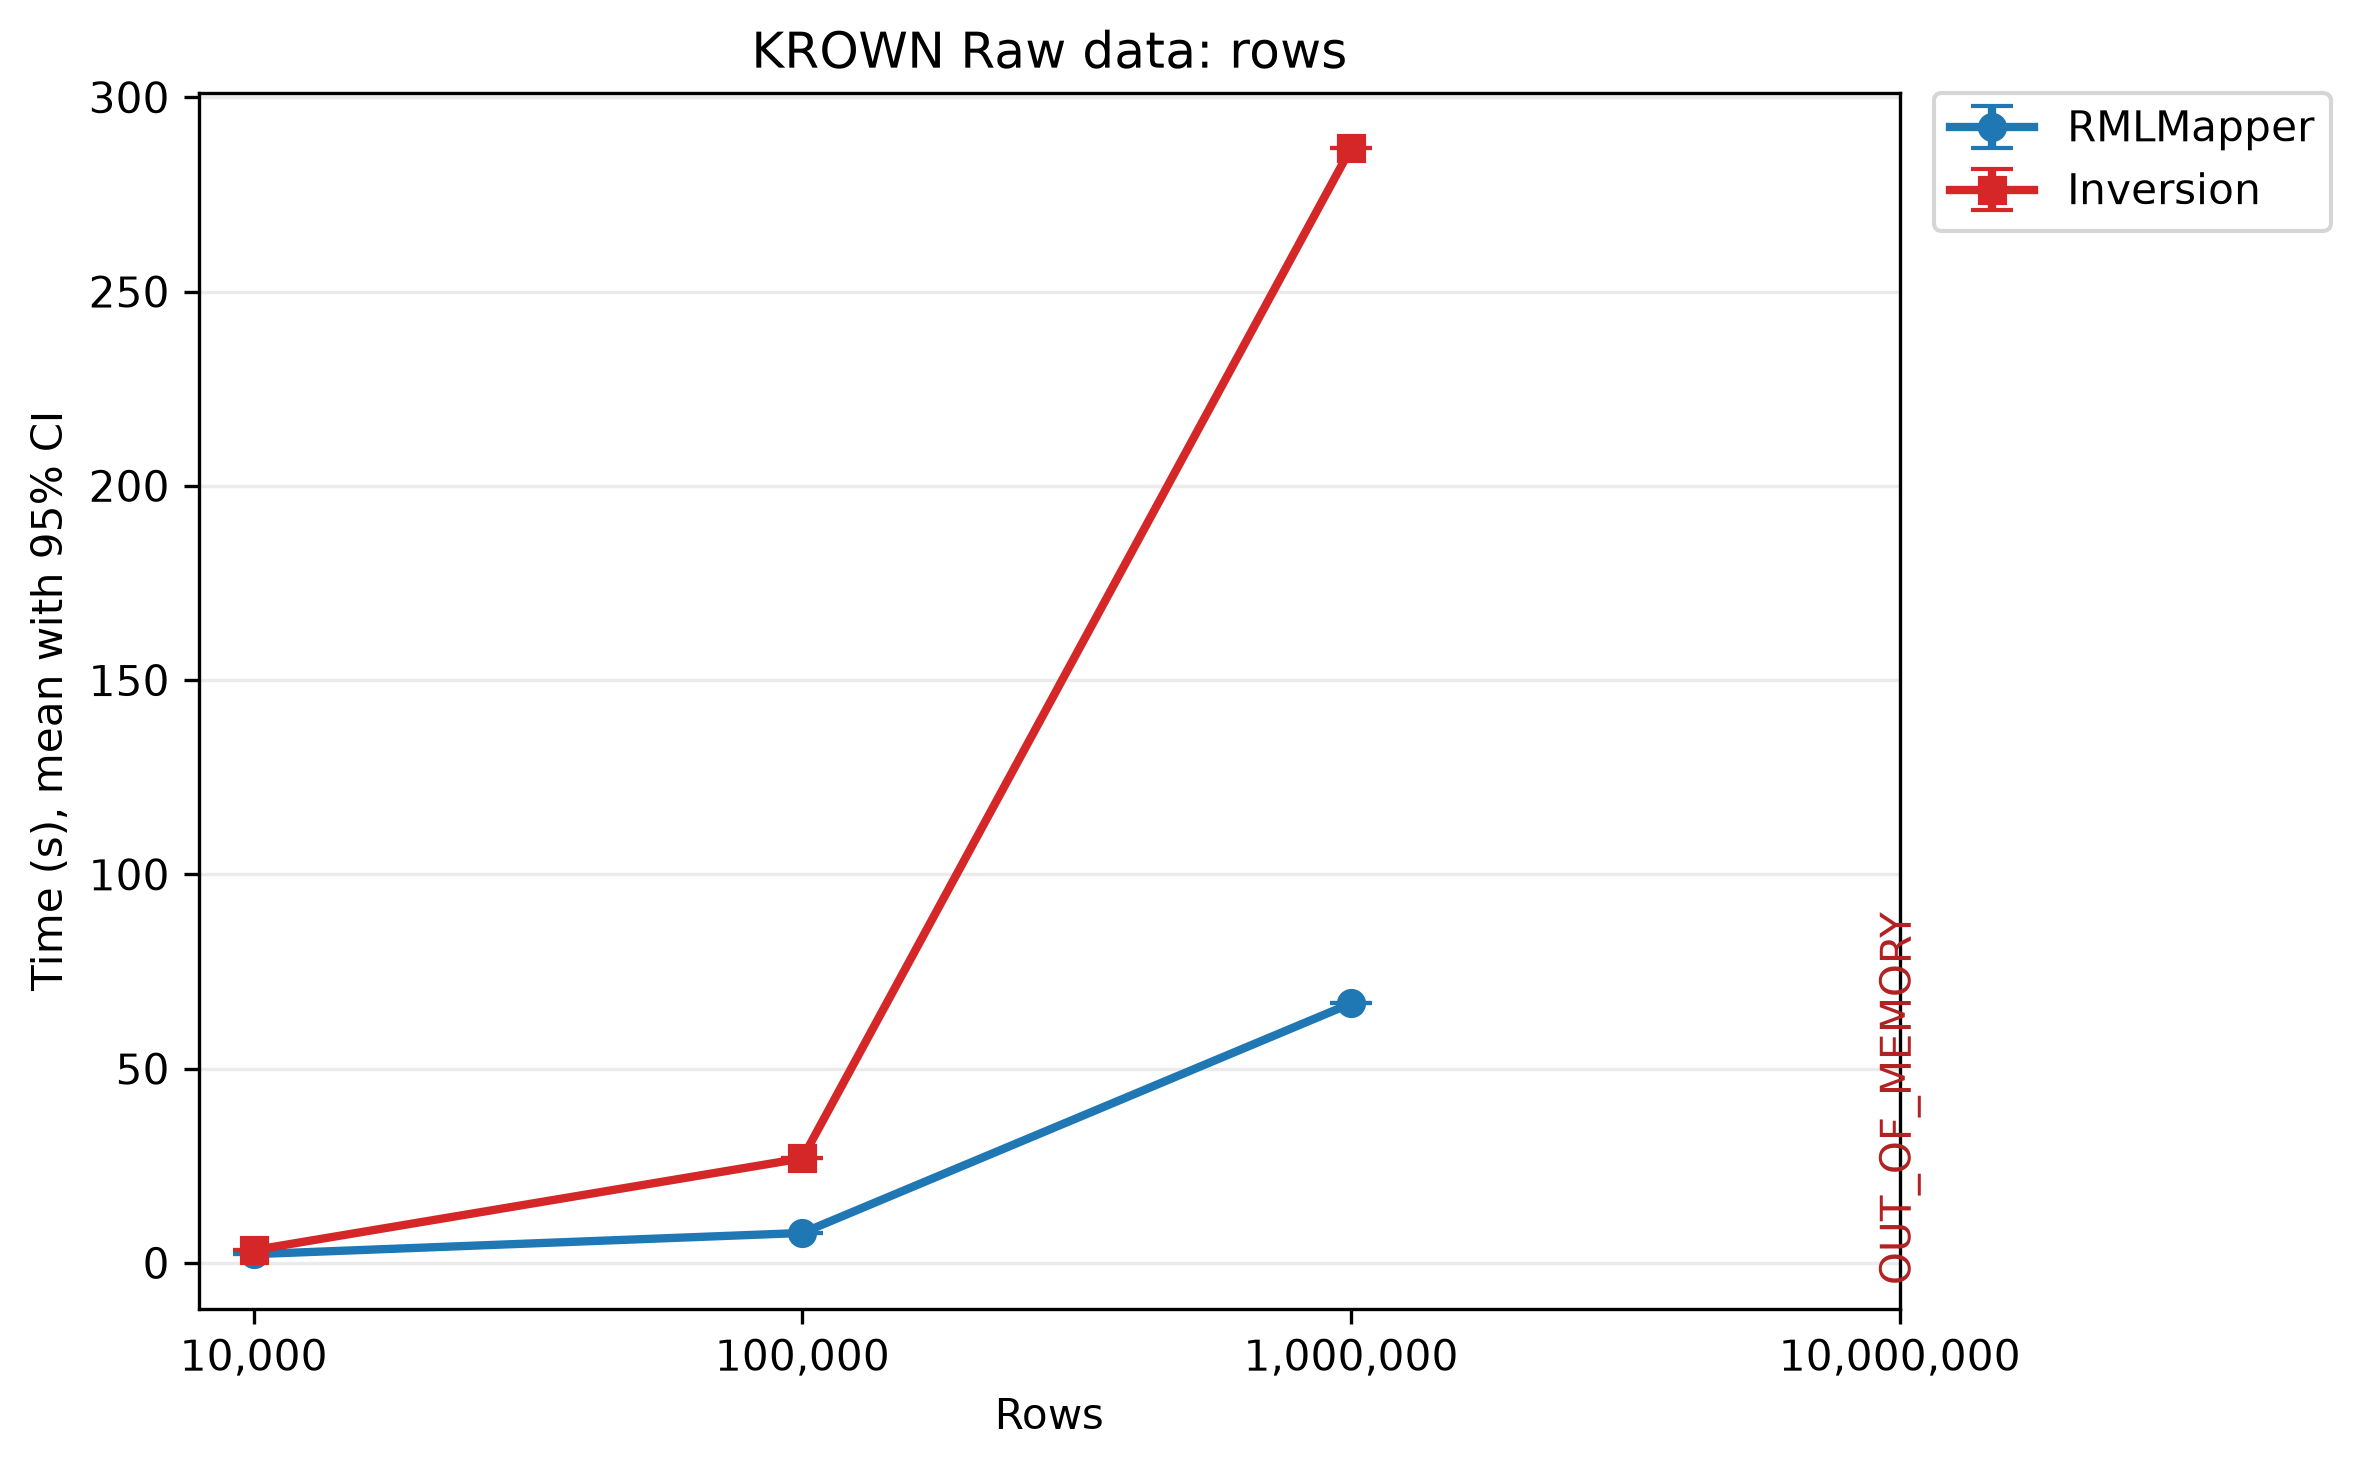
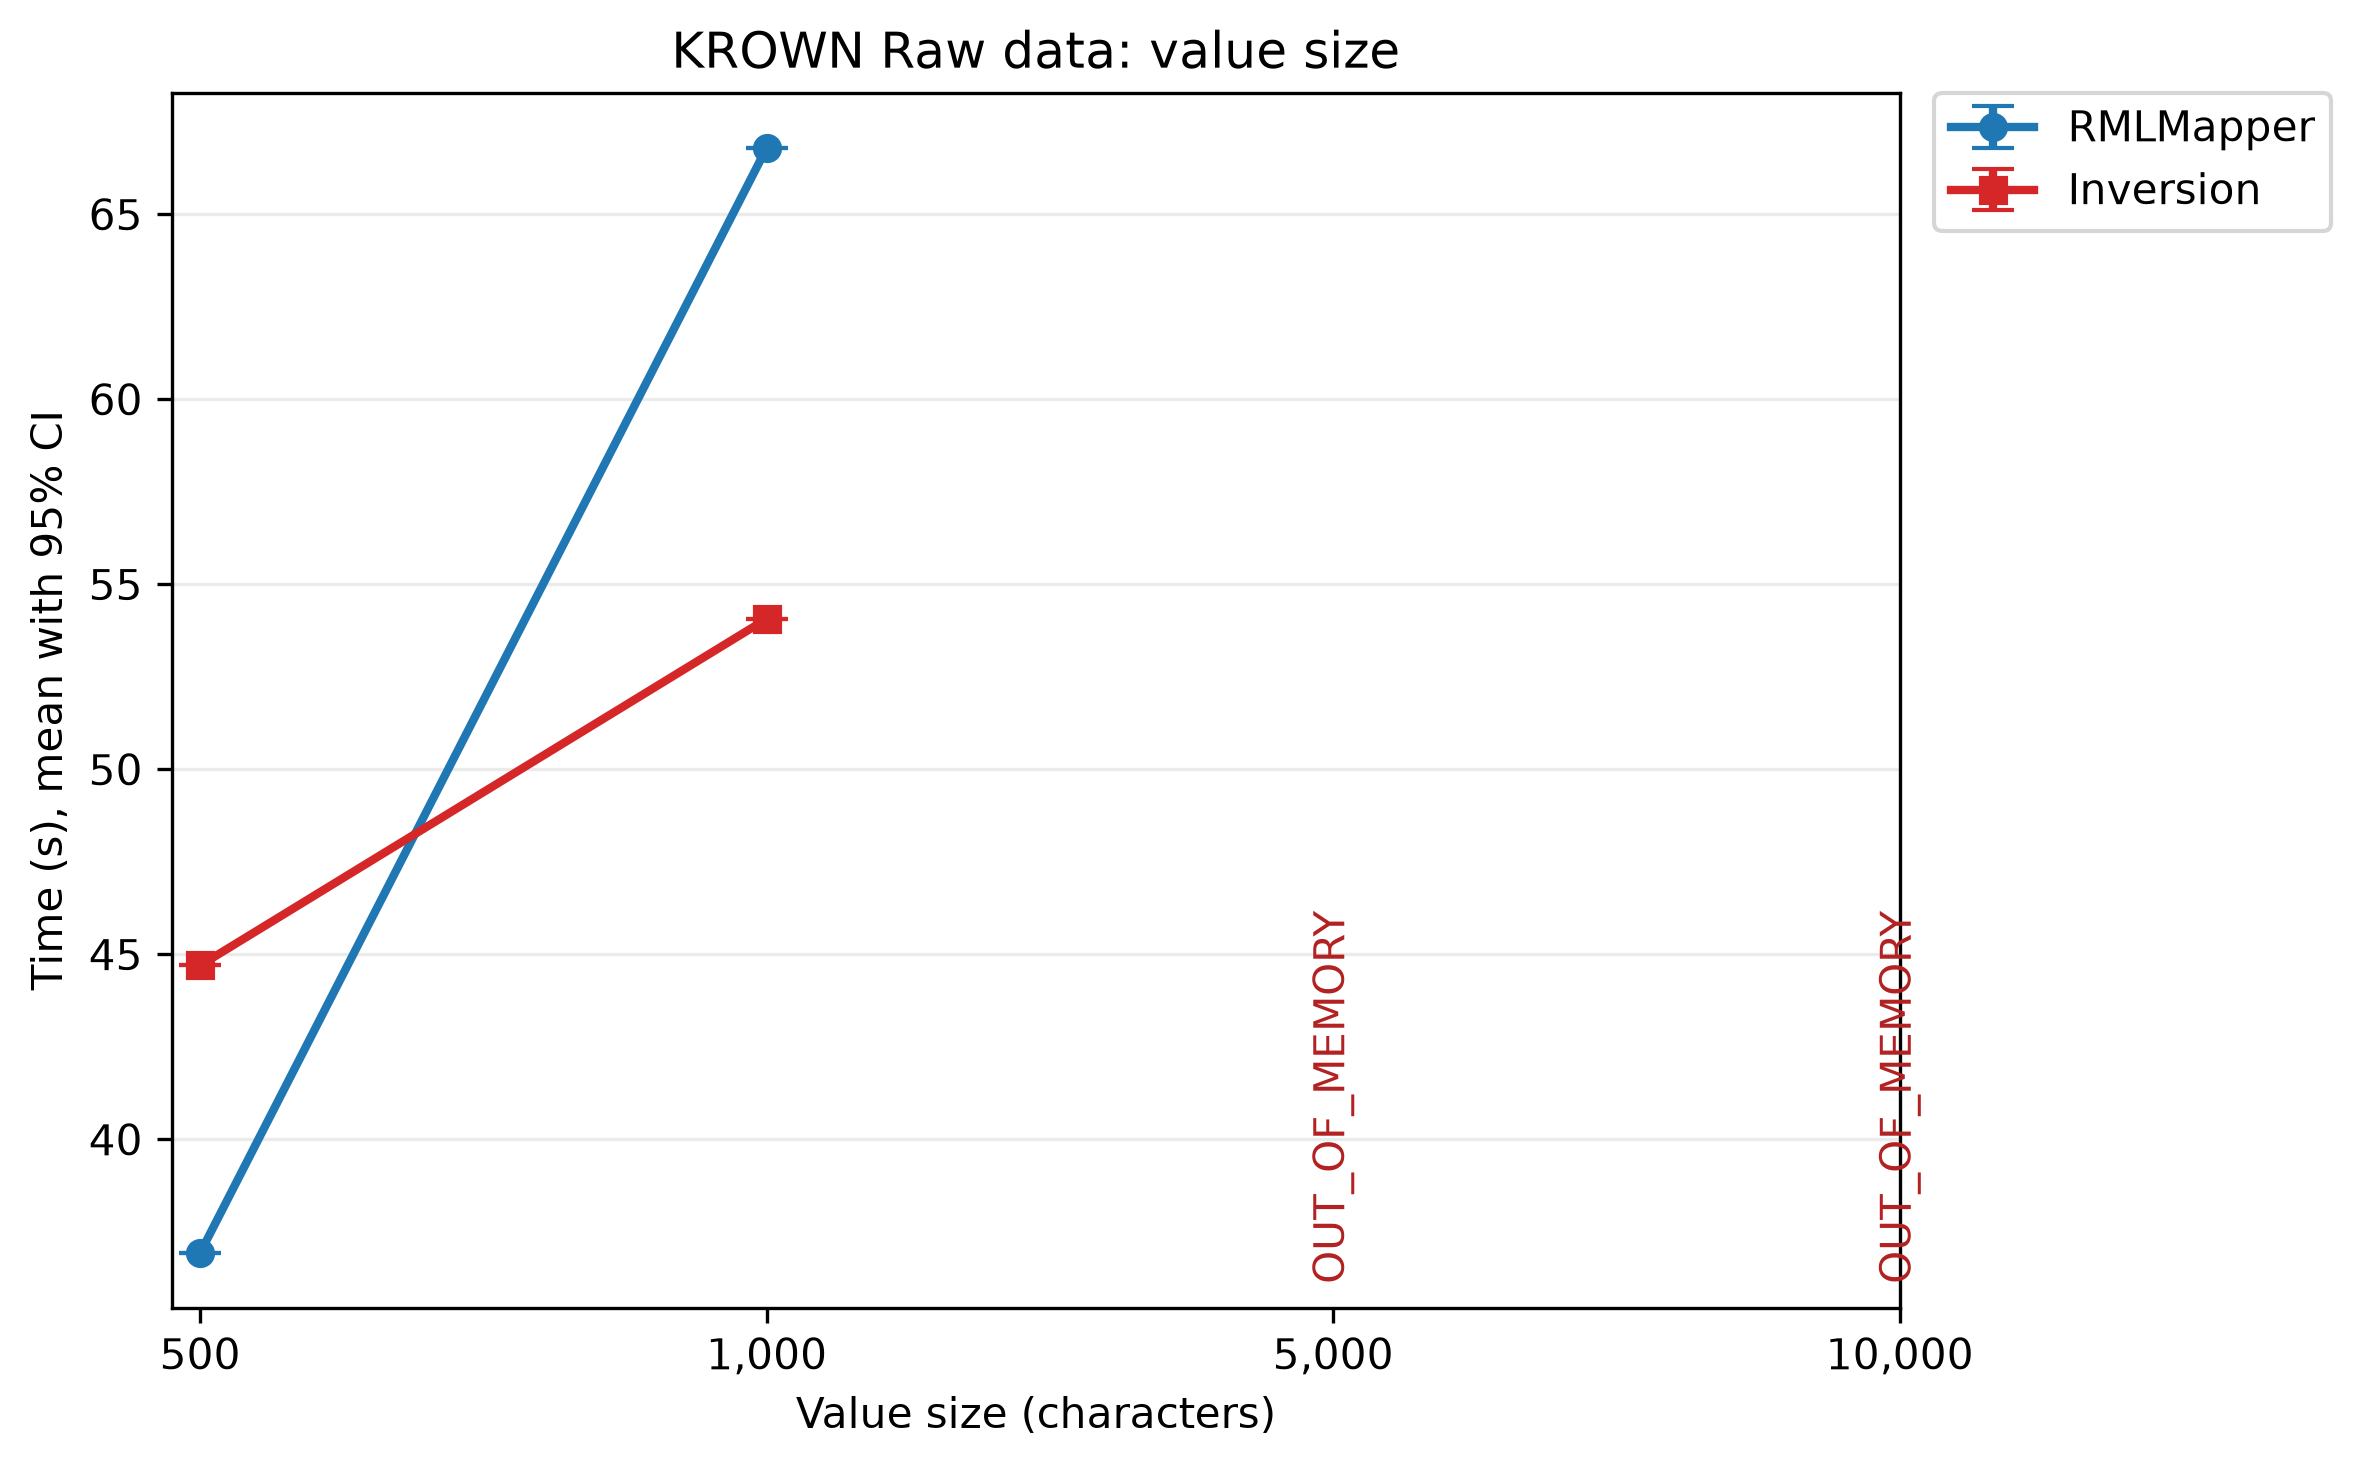
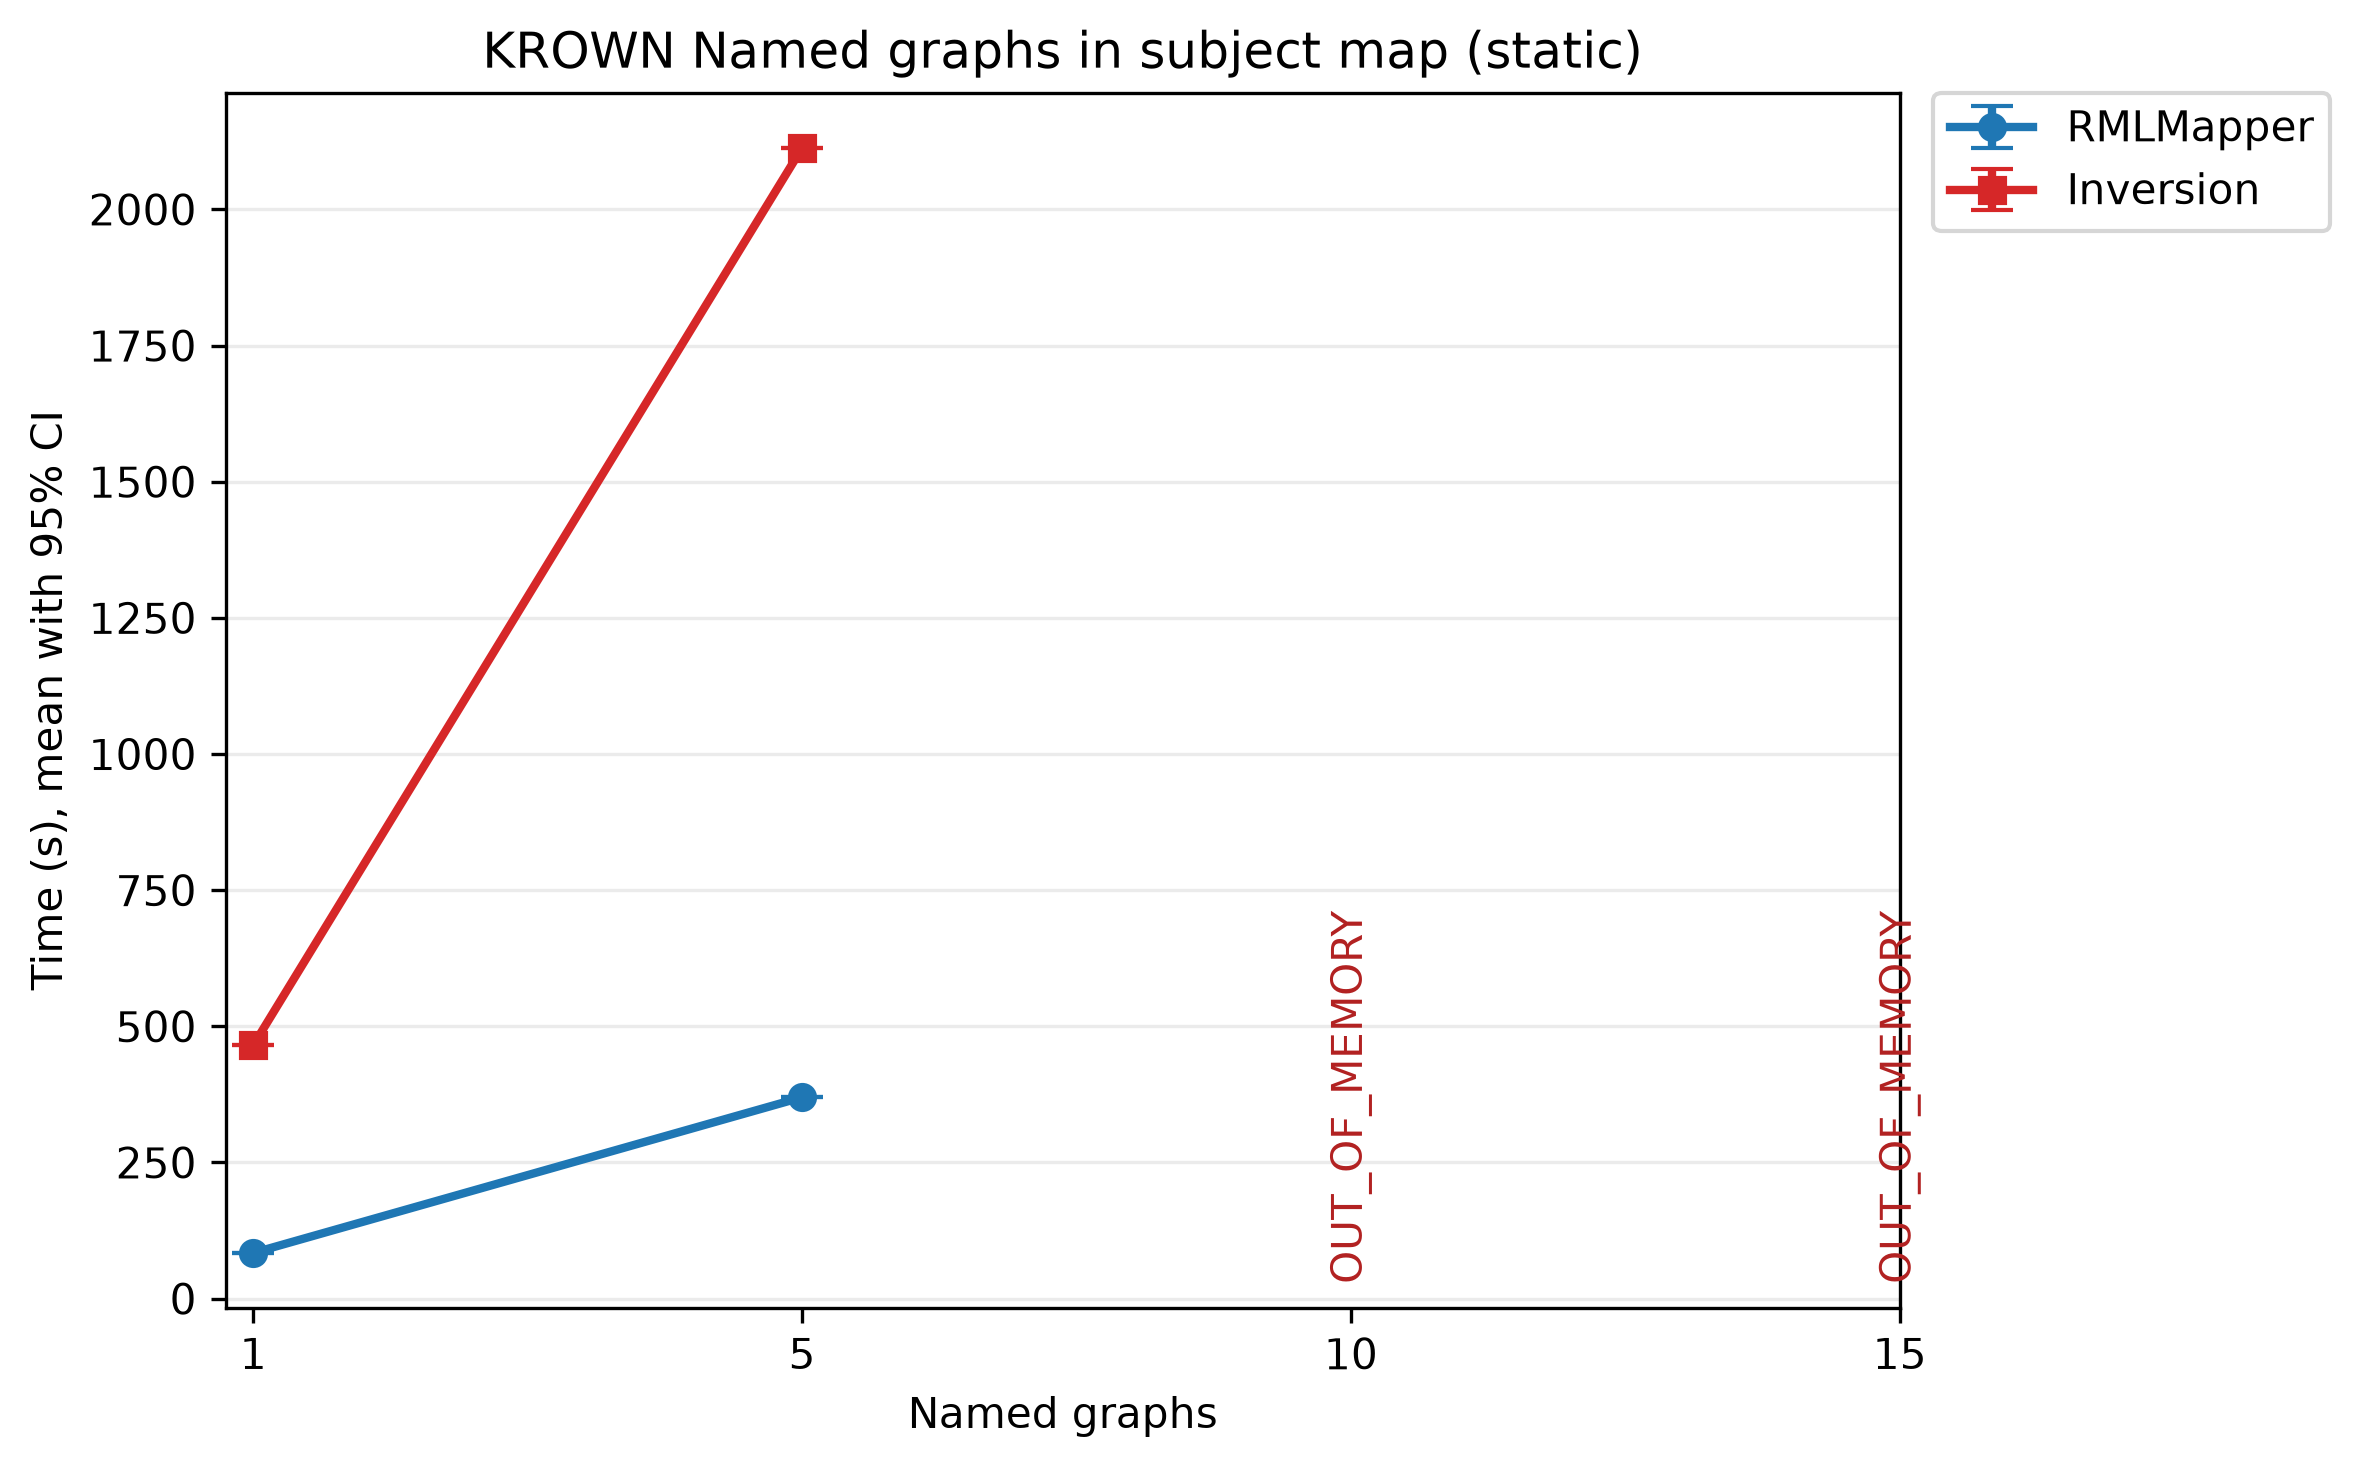
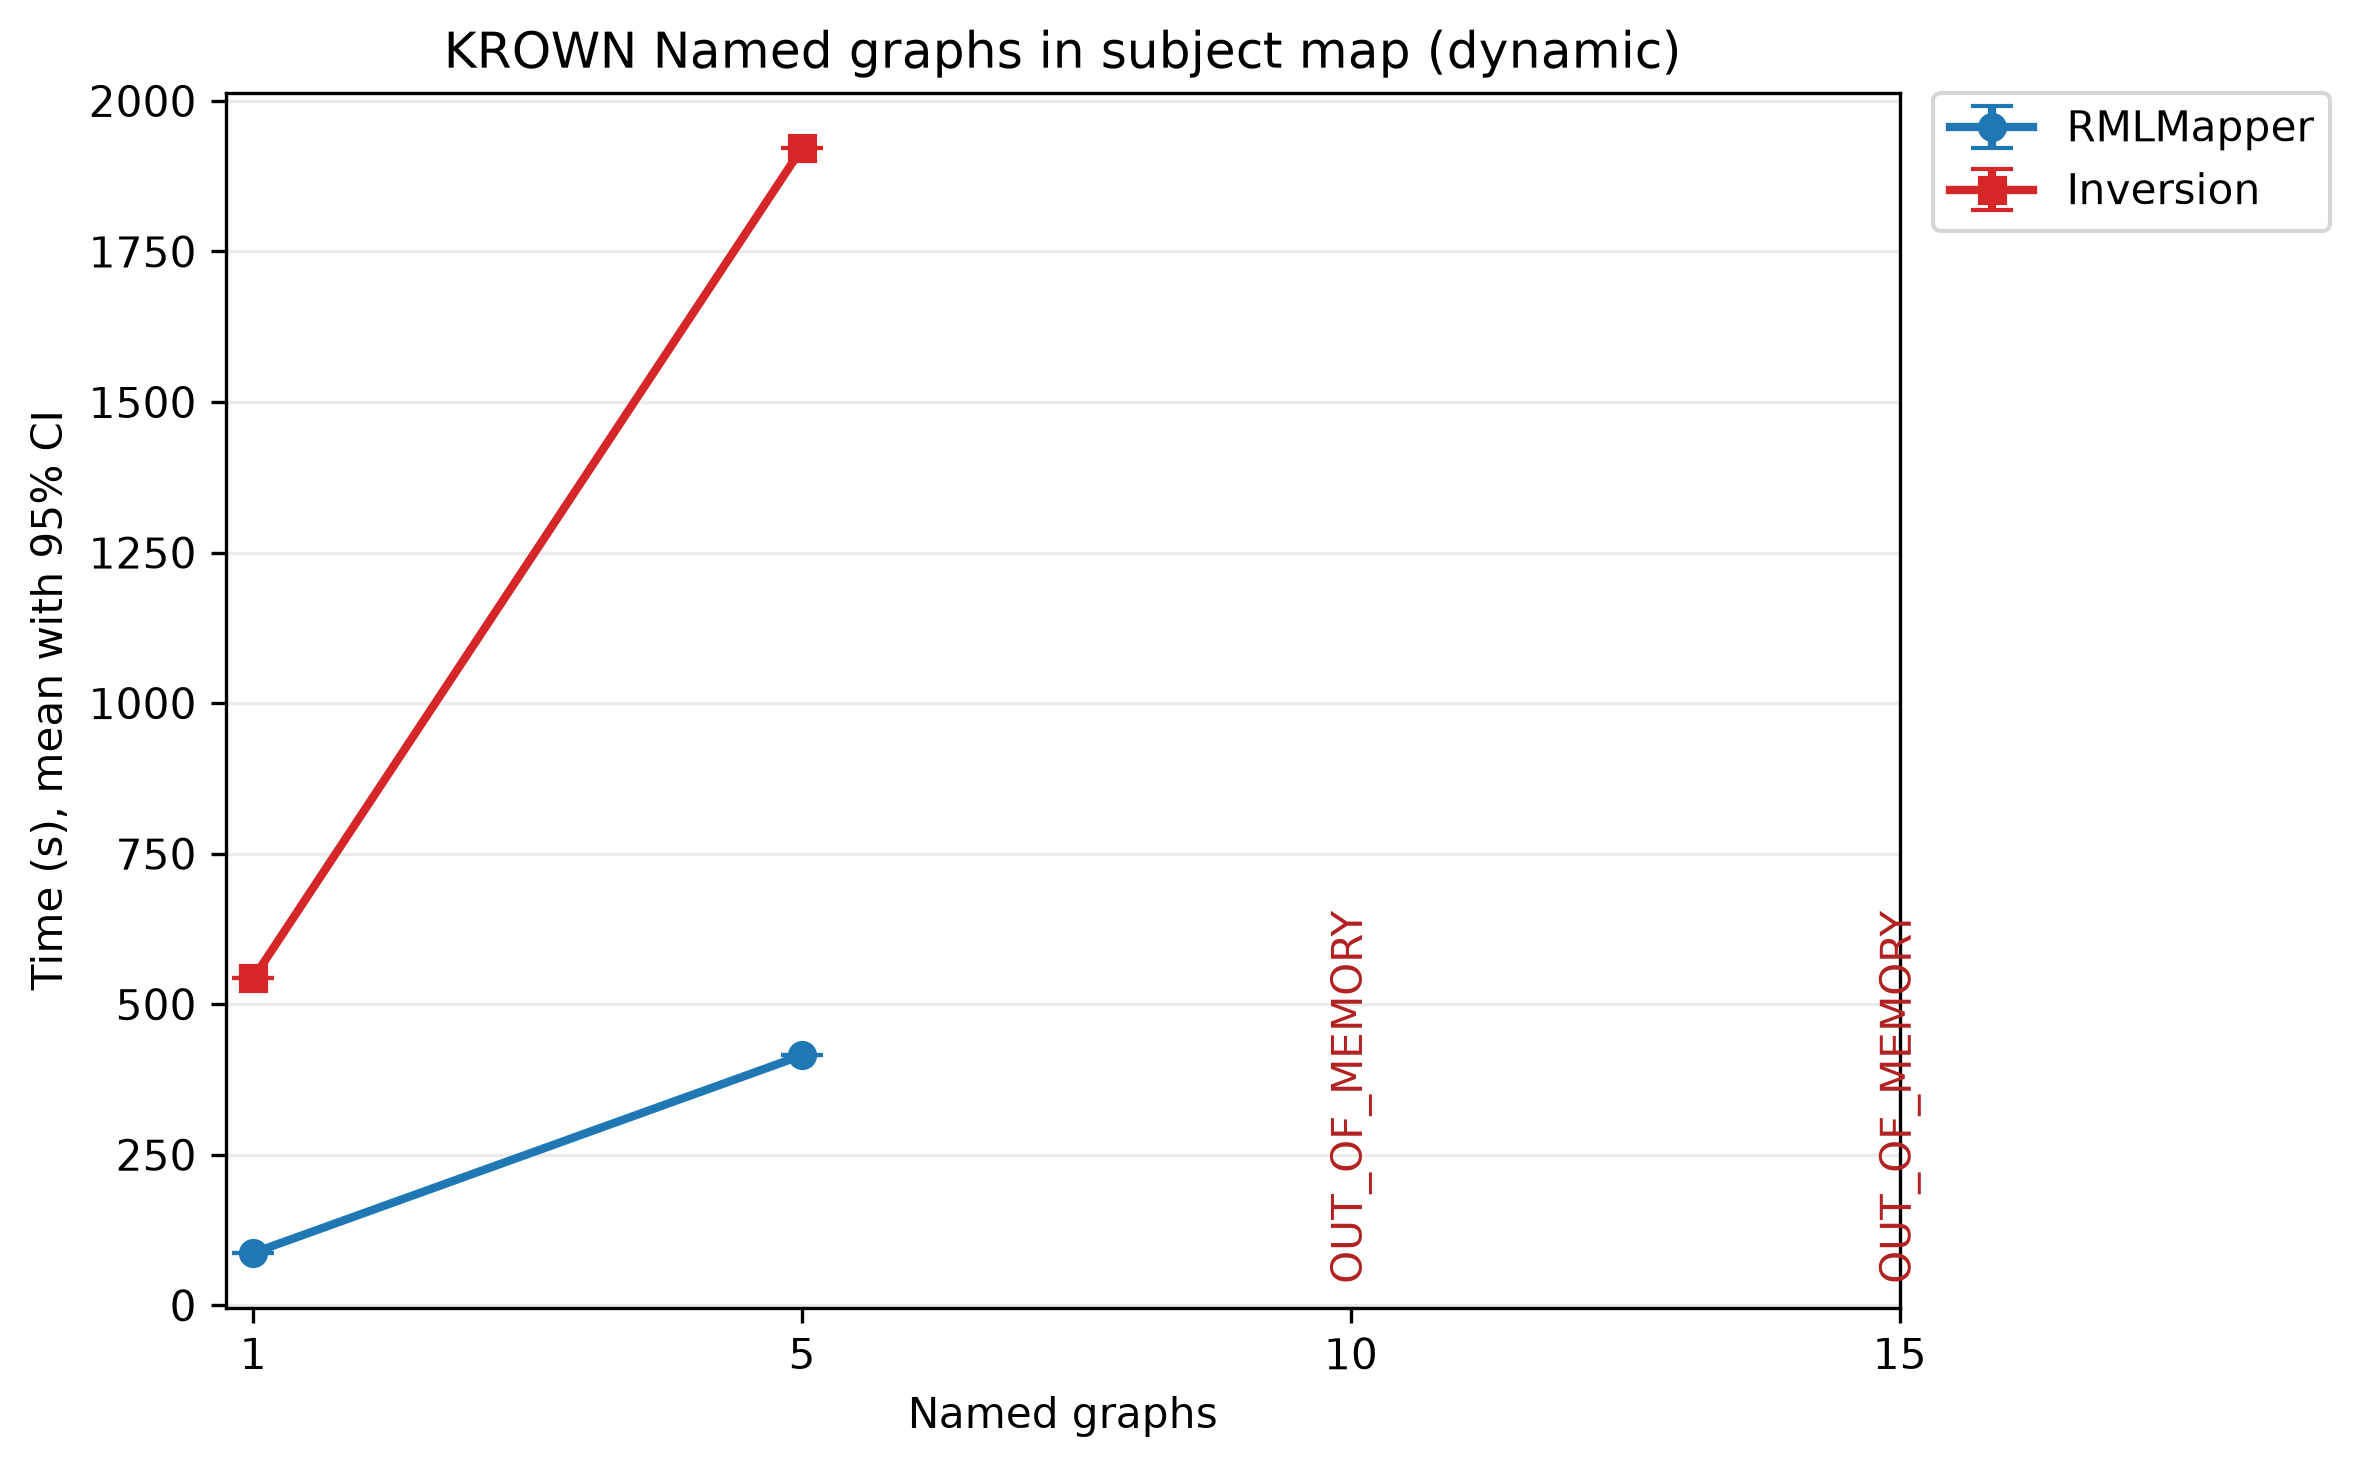
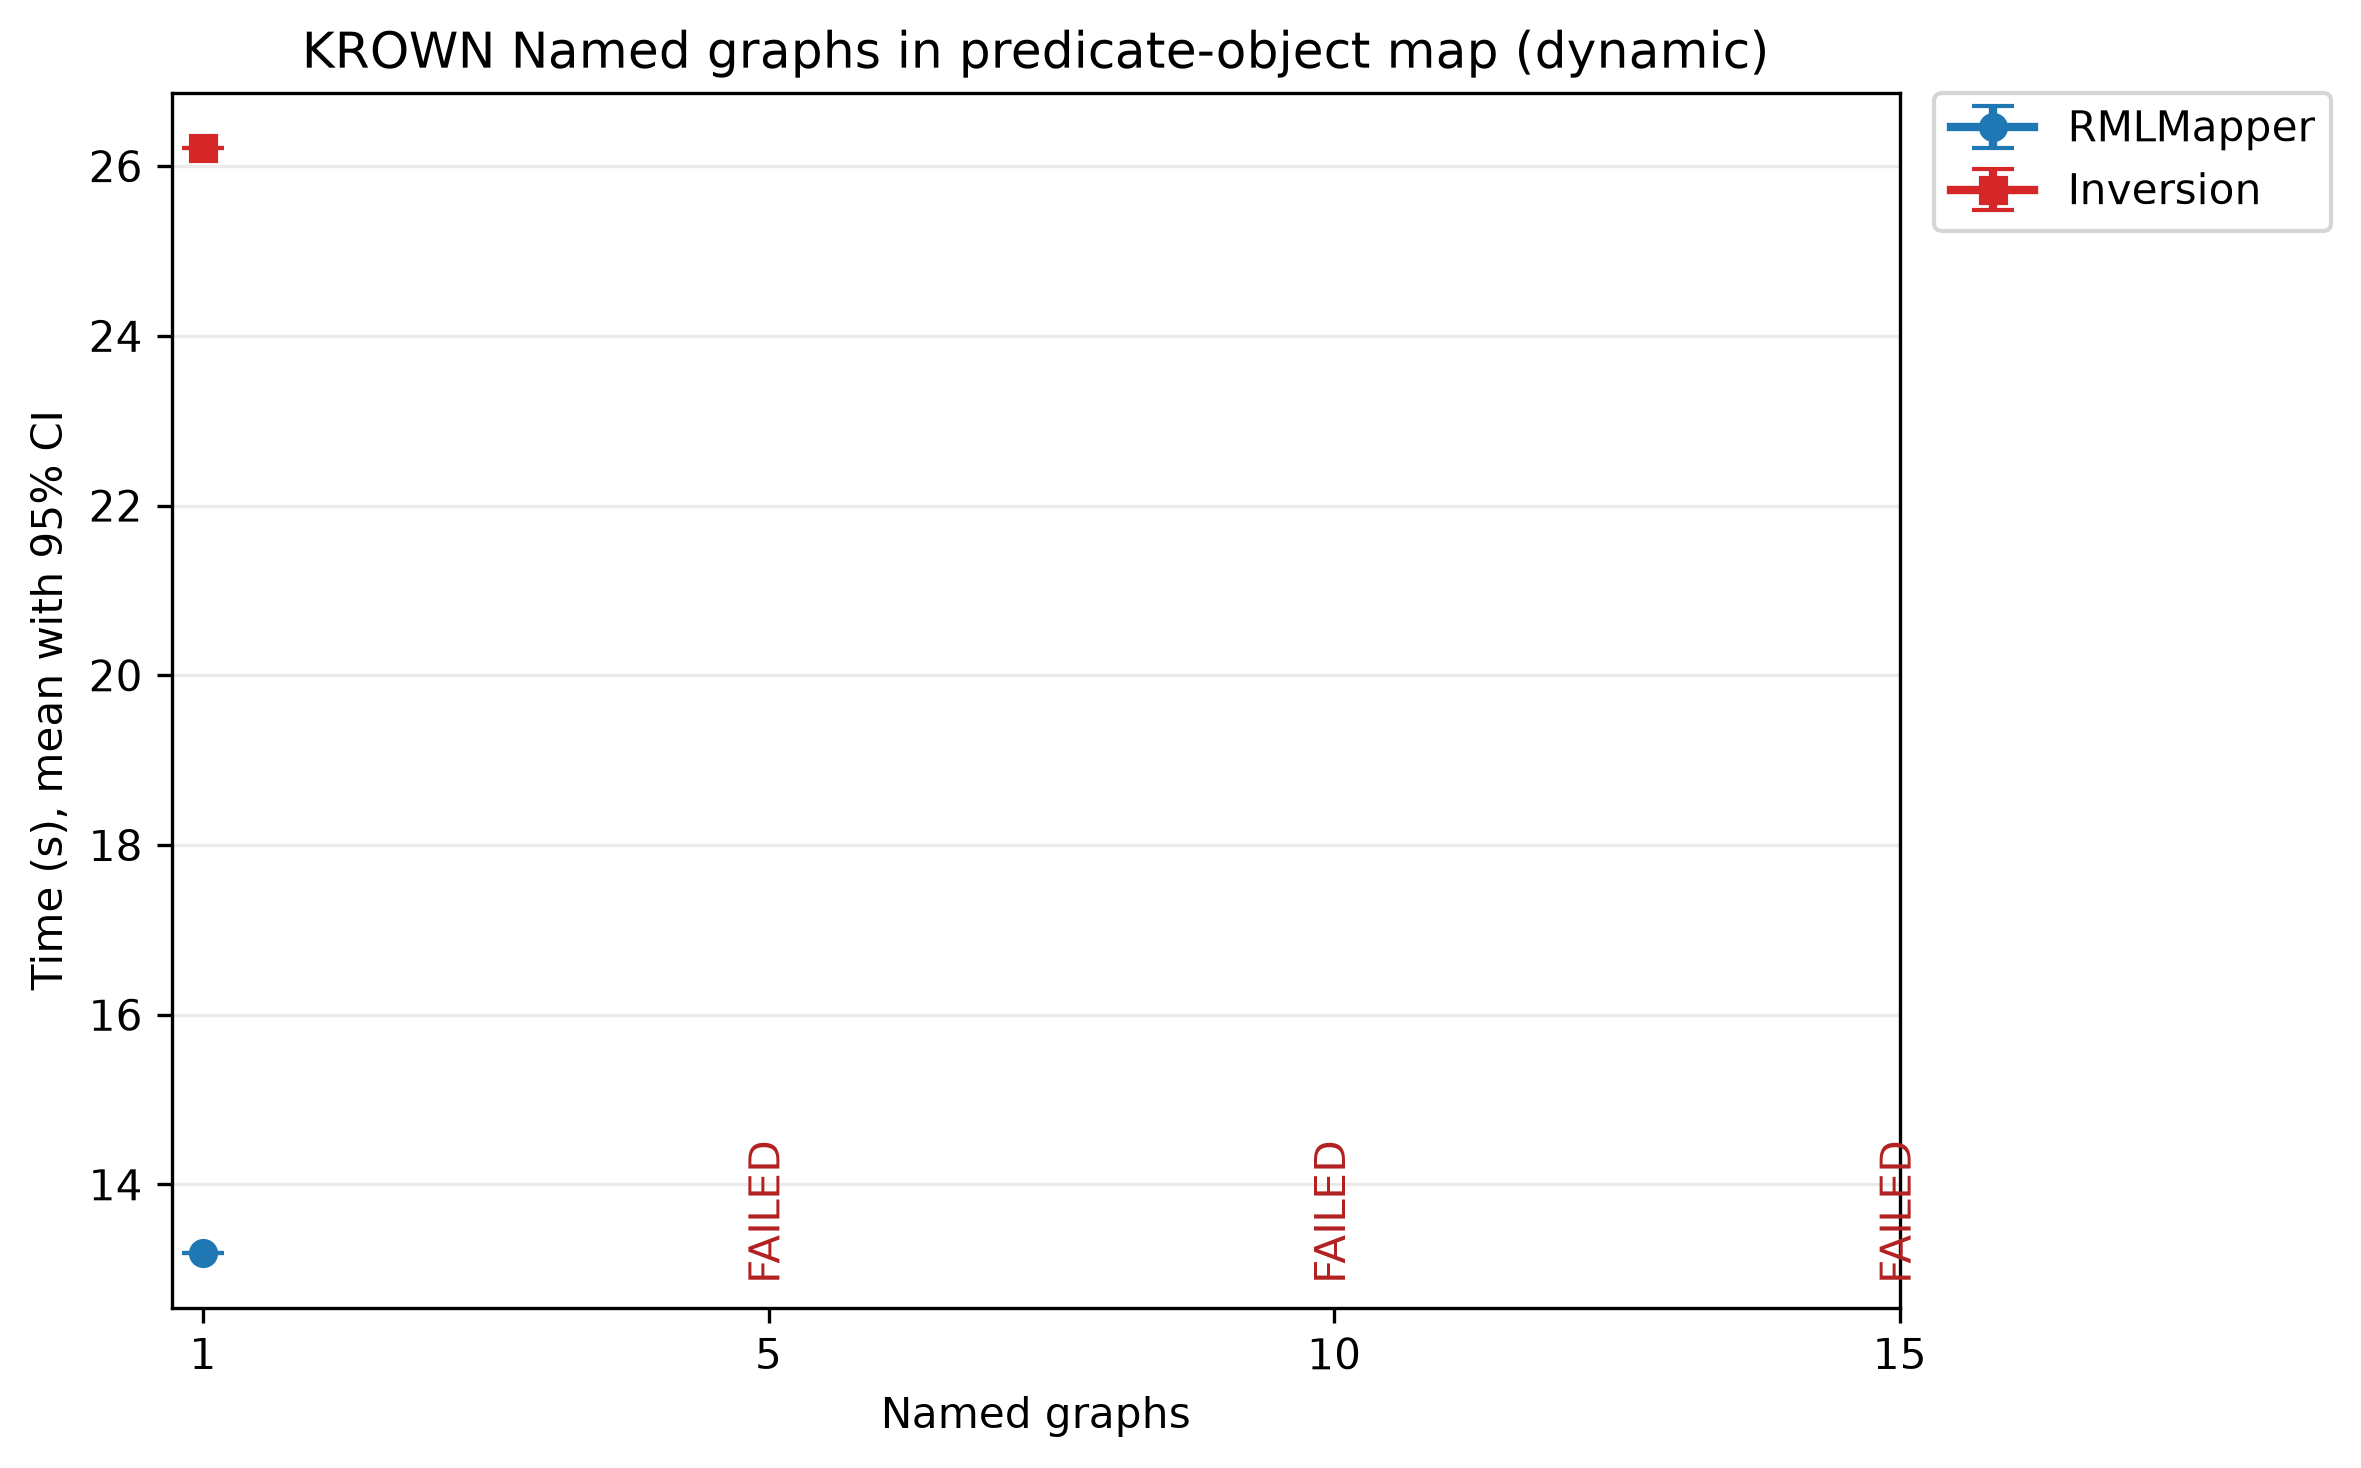
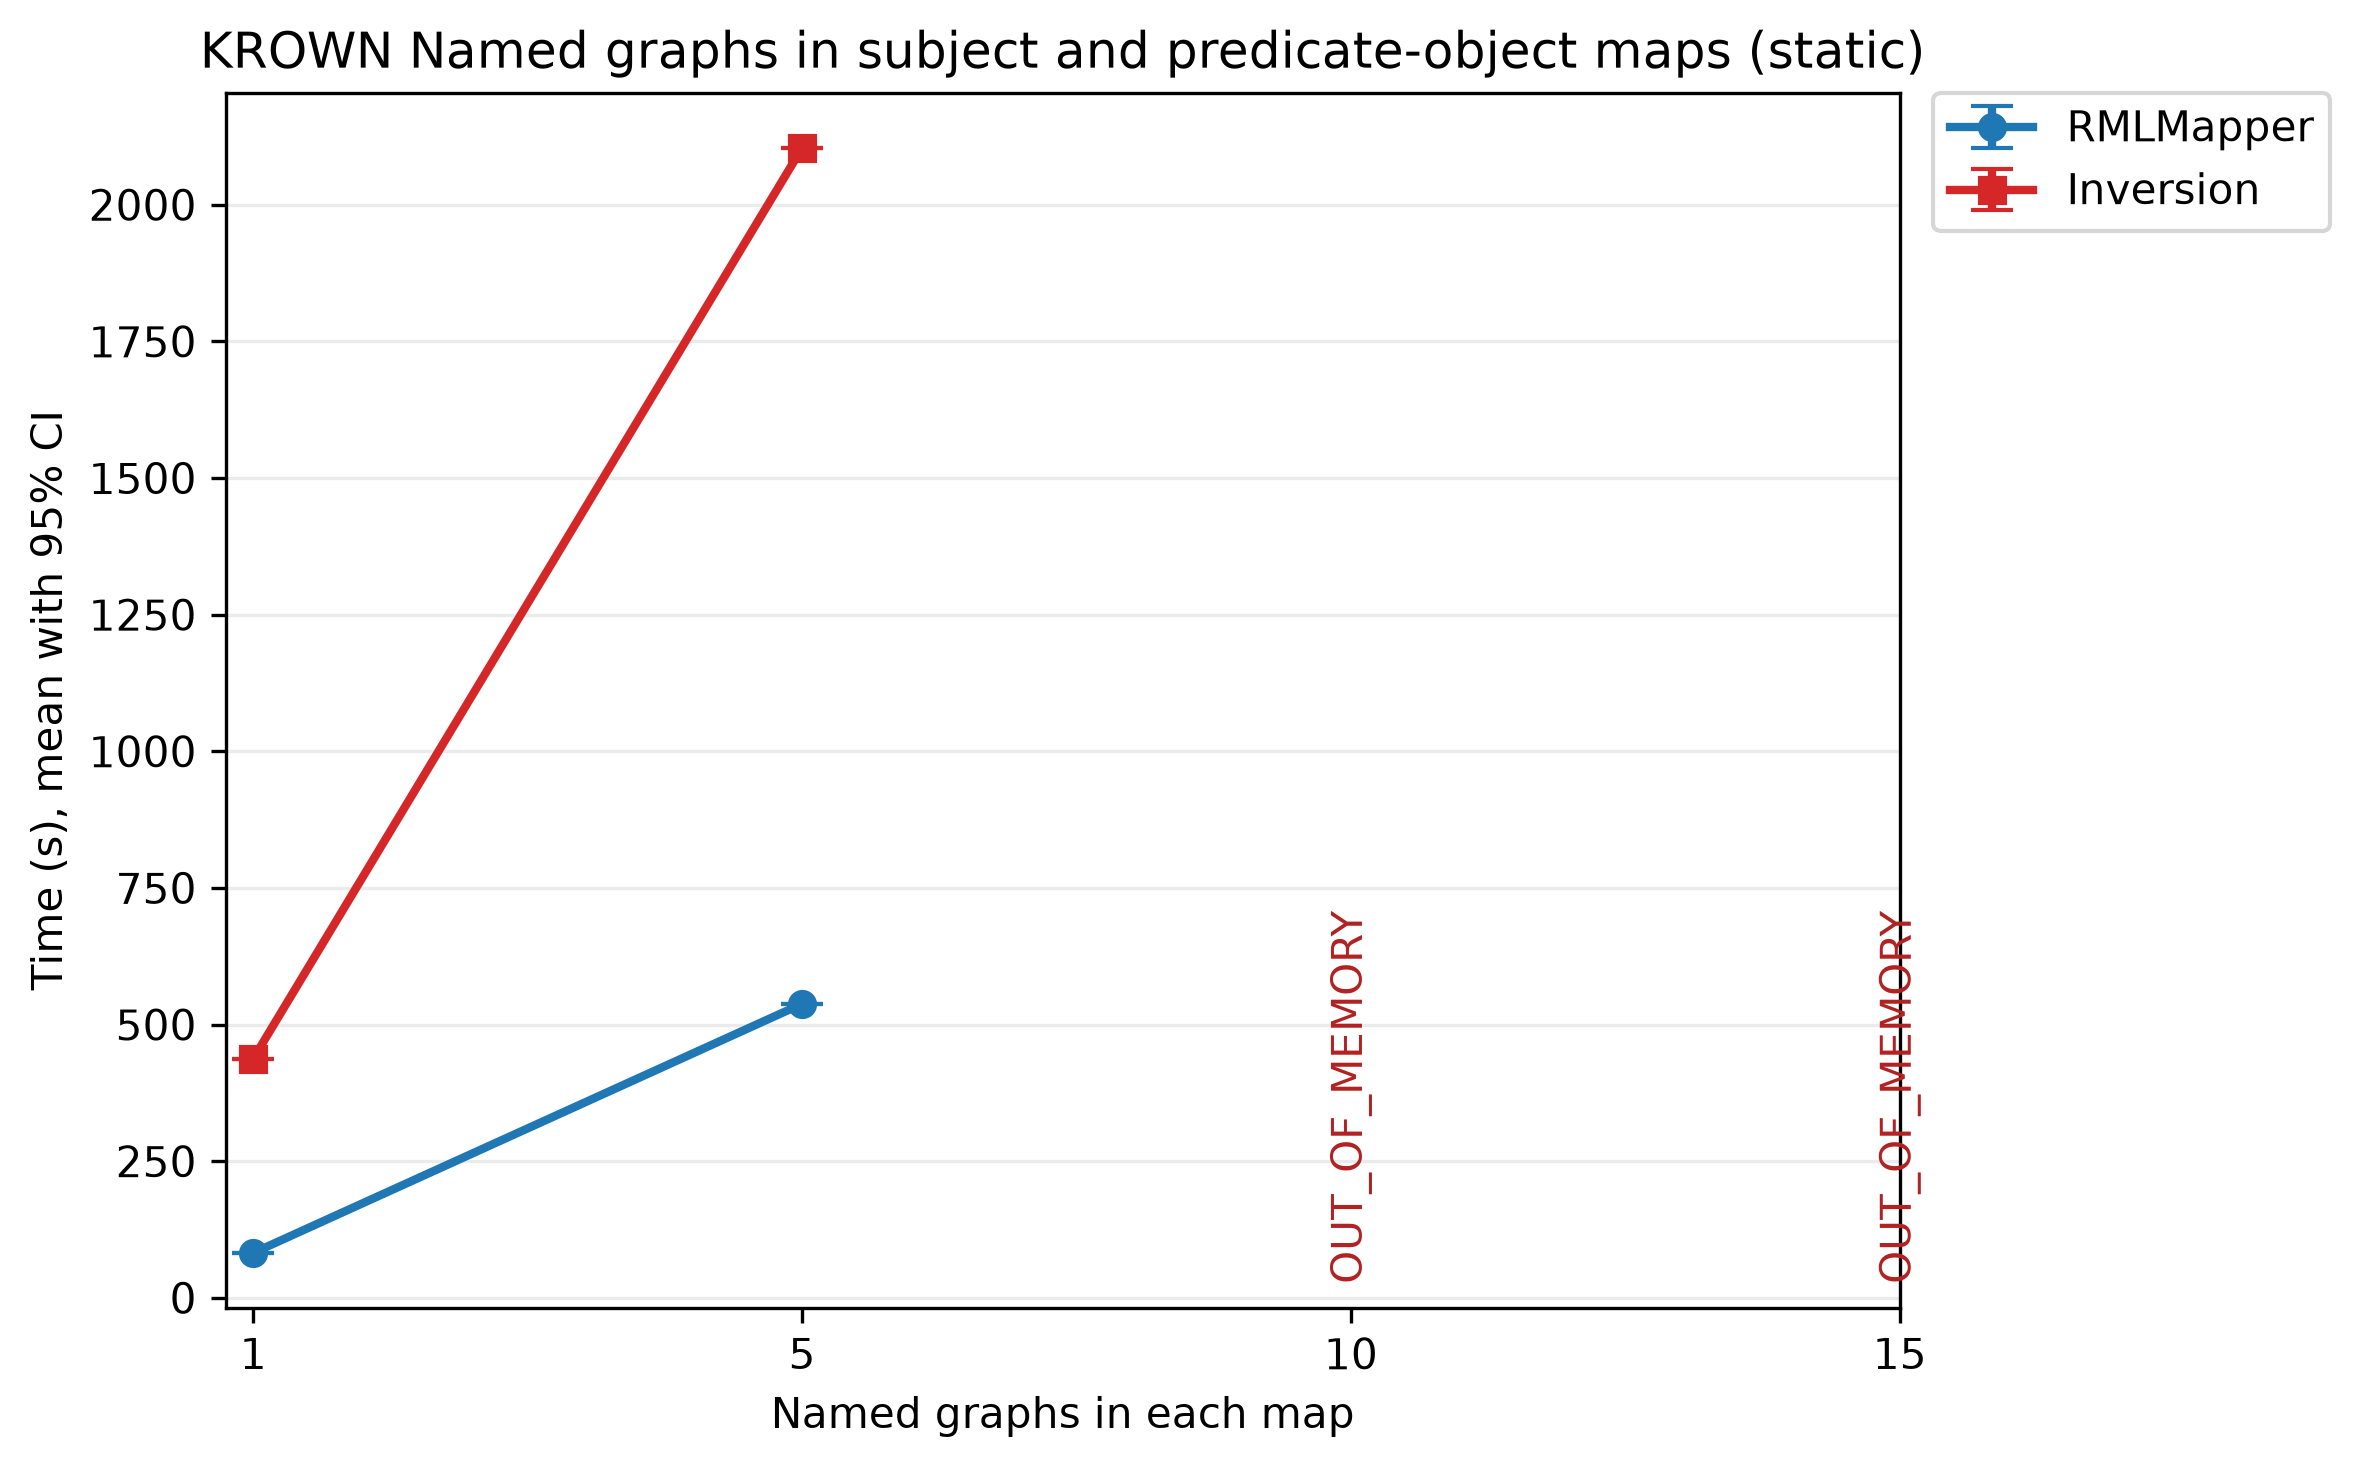
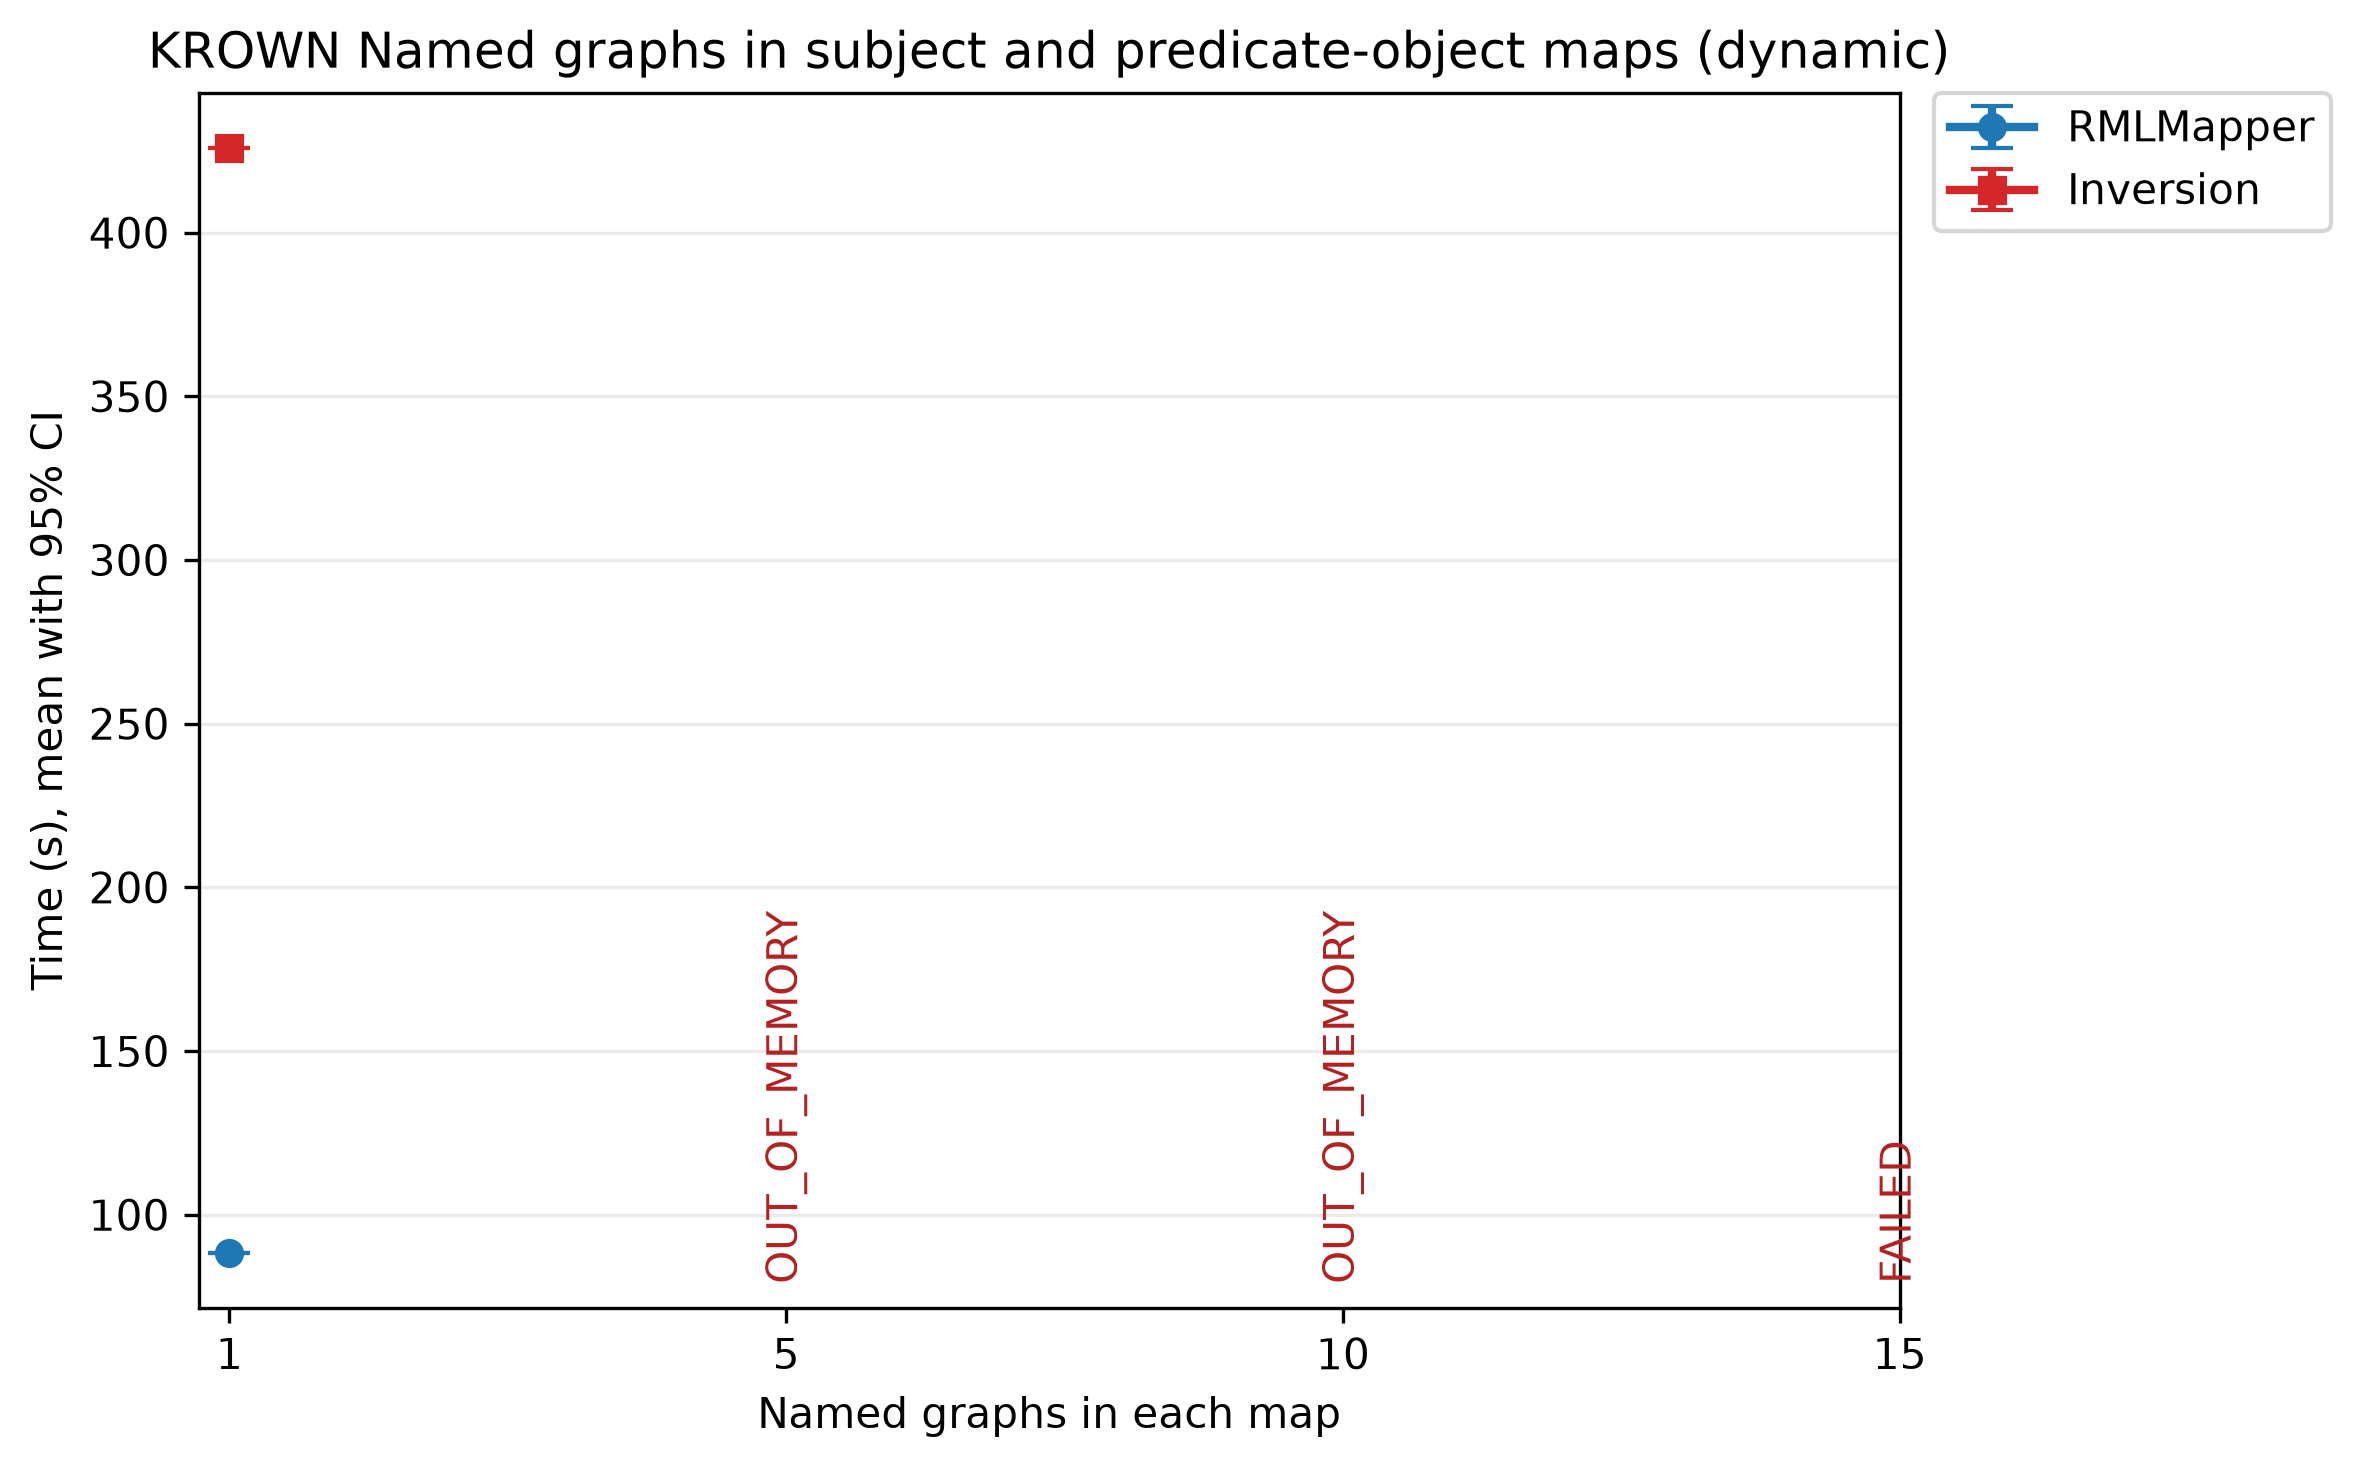
The RMLMapper JVM limited its heap to 50% of the memory visible to Java, and each materialization had a 10,800-second limit. Seven scenarios exhausted memory: the 10-million-row case, the cases with cell sizes of 5,000 and 10,000 characters, and the four cases with 15 Named Graphs. The scenarios with 5, 10, and 15 join conditions reached the time limit. The KROWN 0.9.0 results provide the corresponding reference campaign.
Inversion overhead#
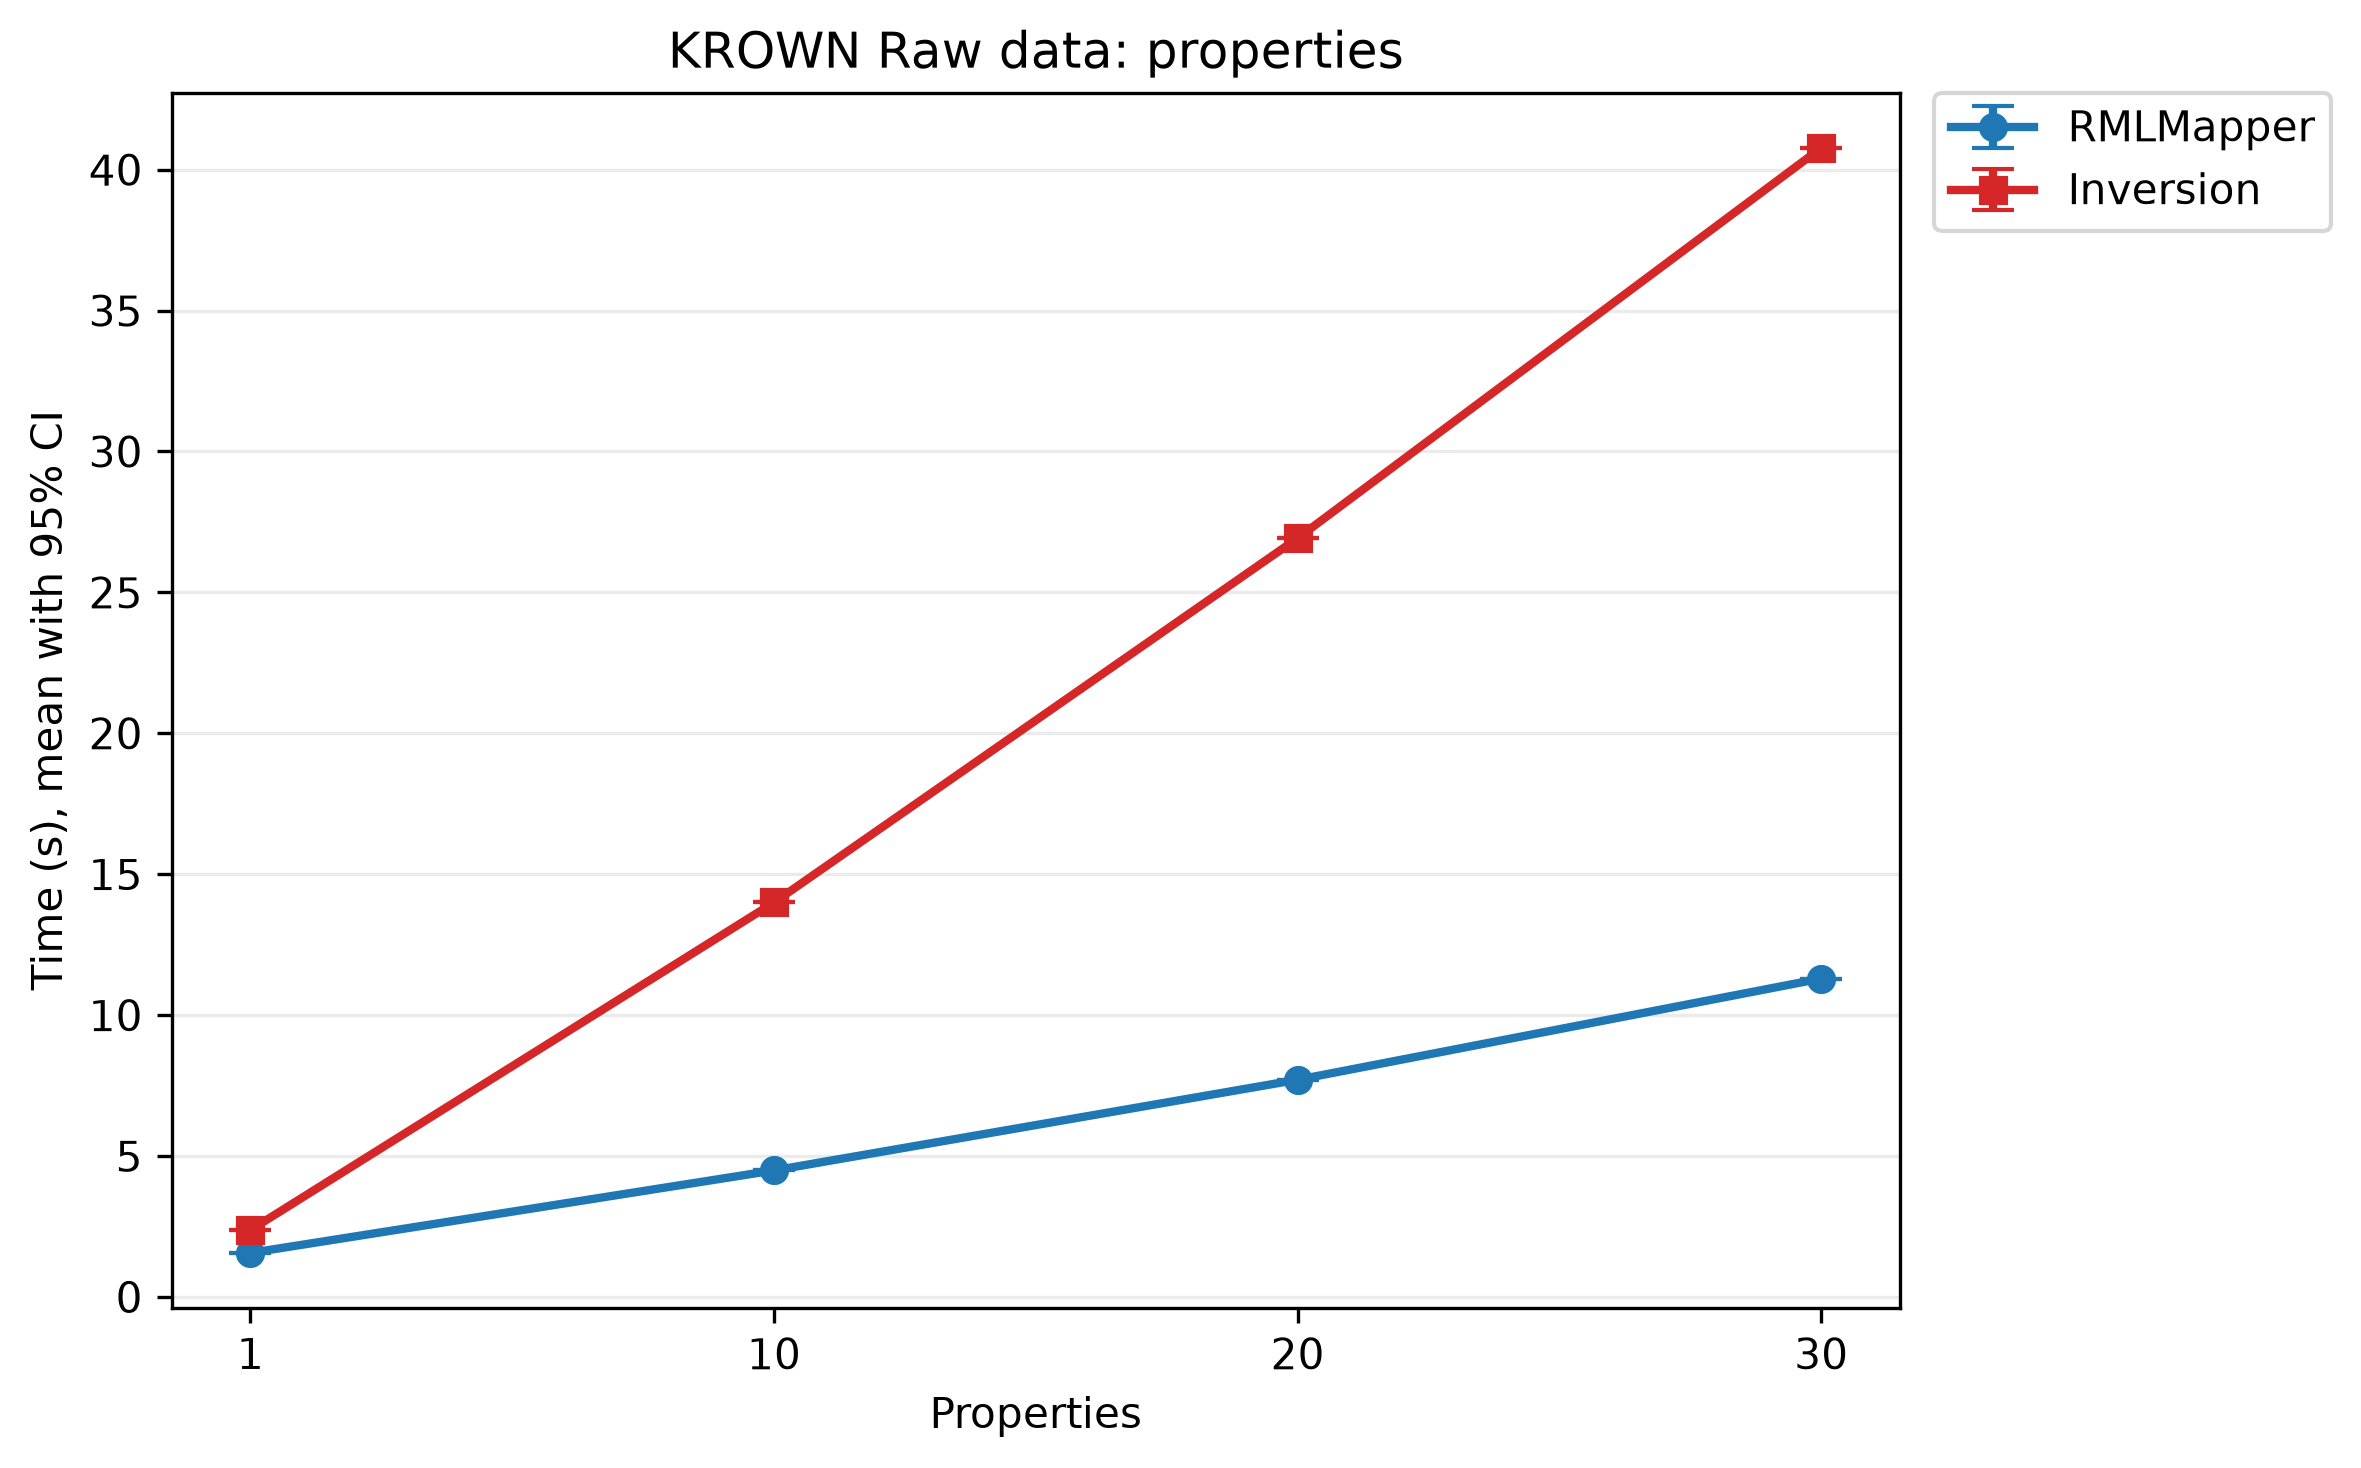
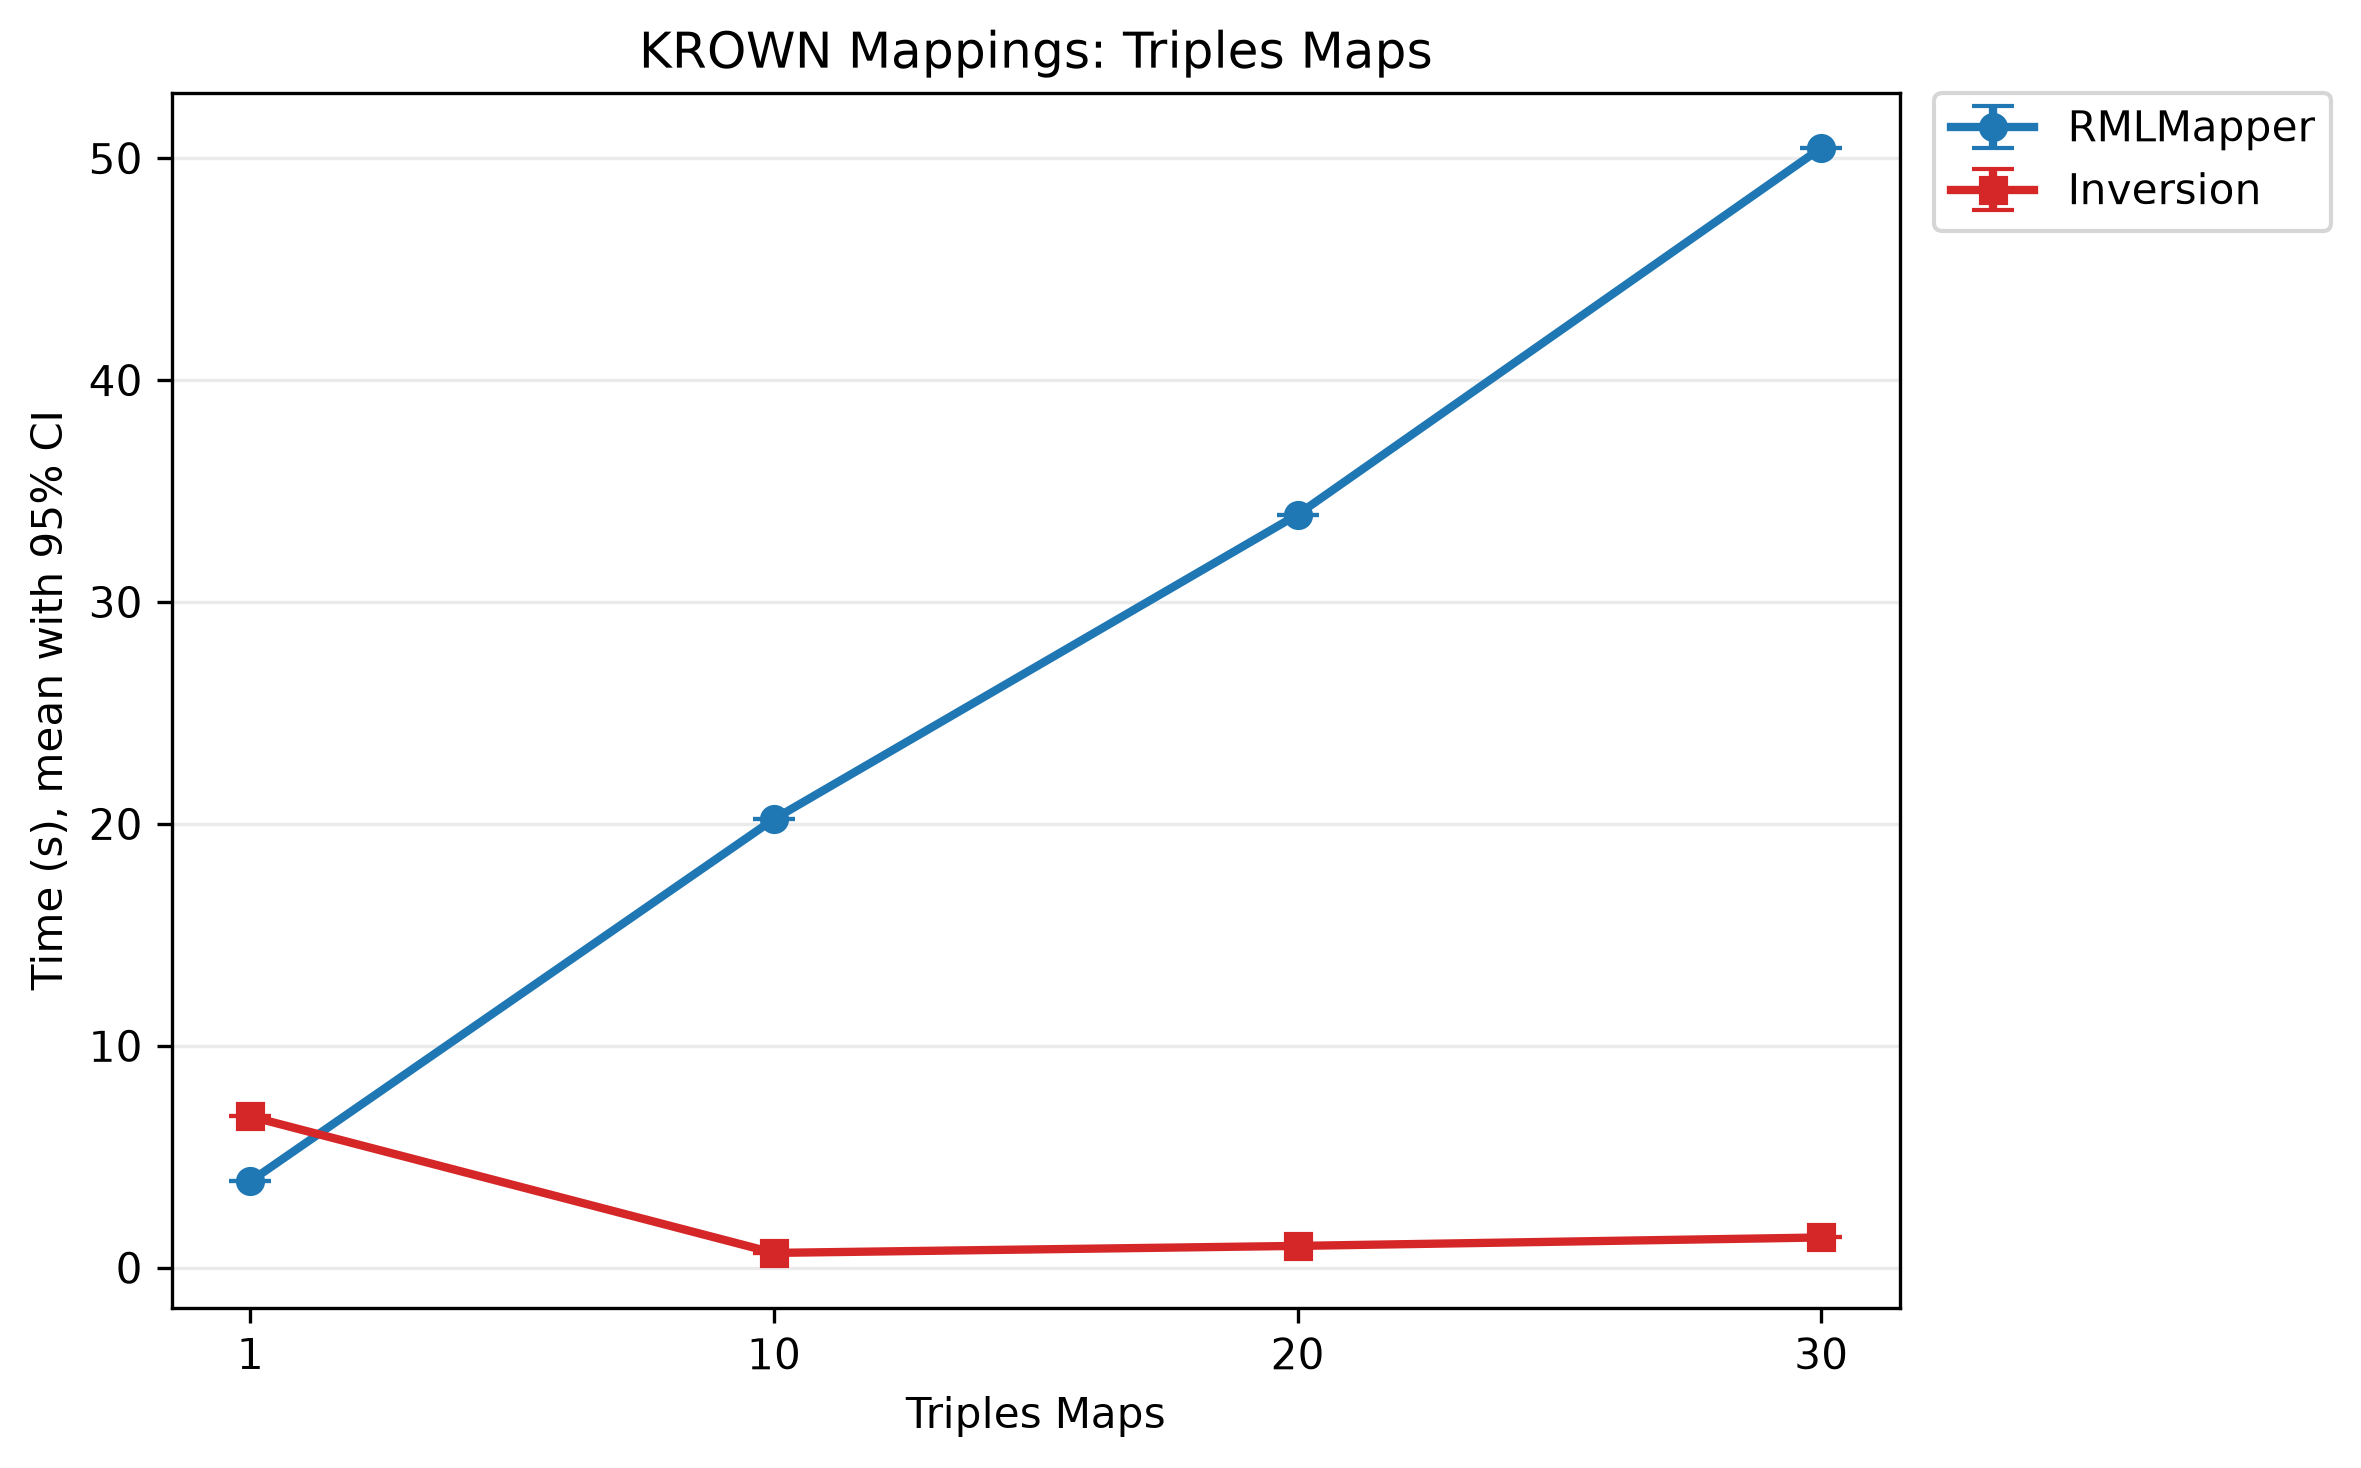
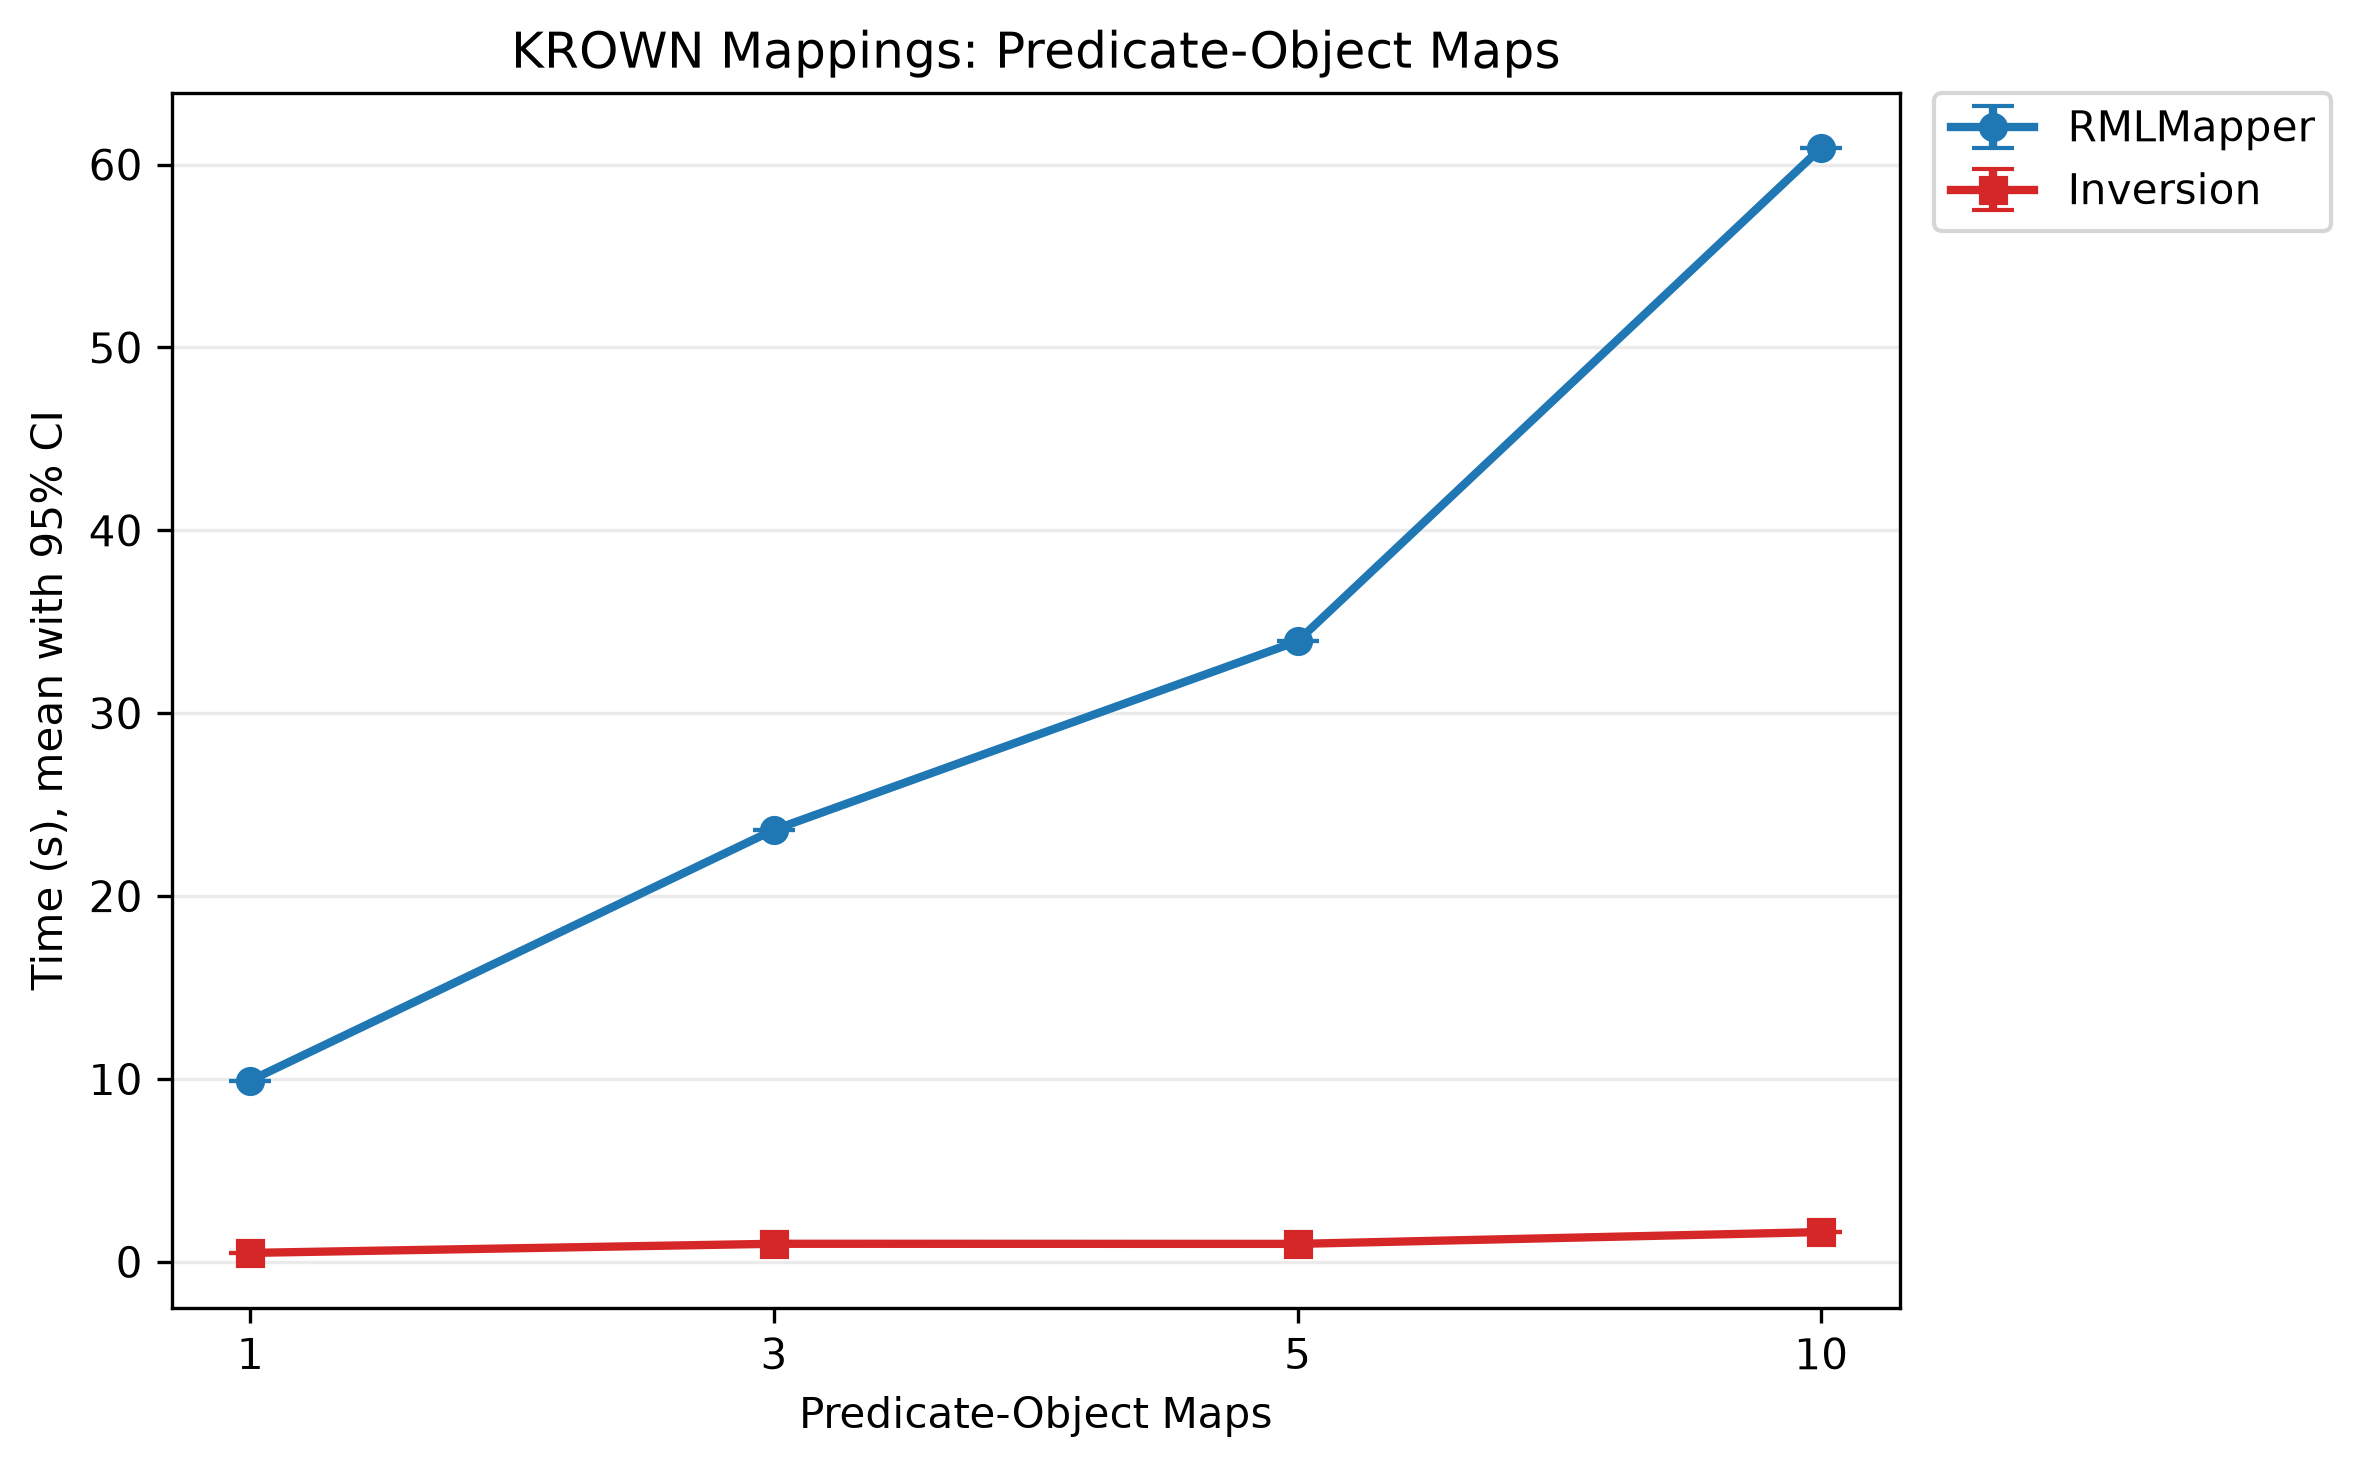
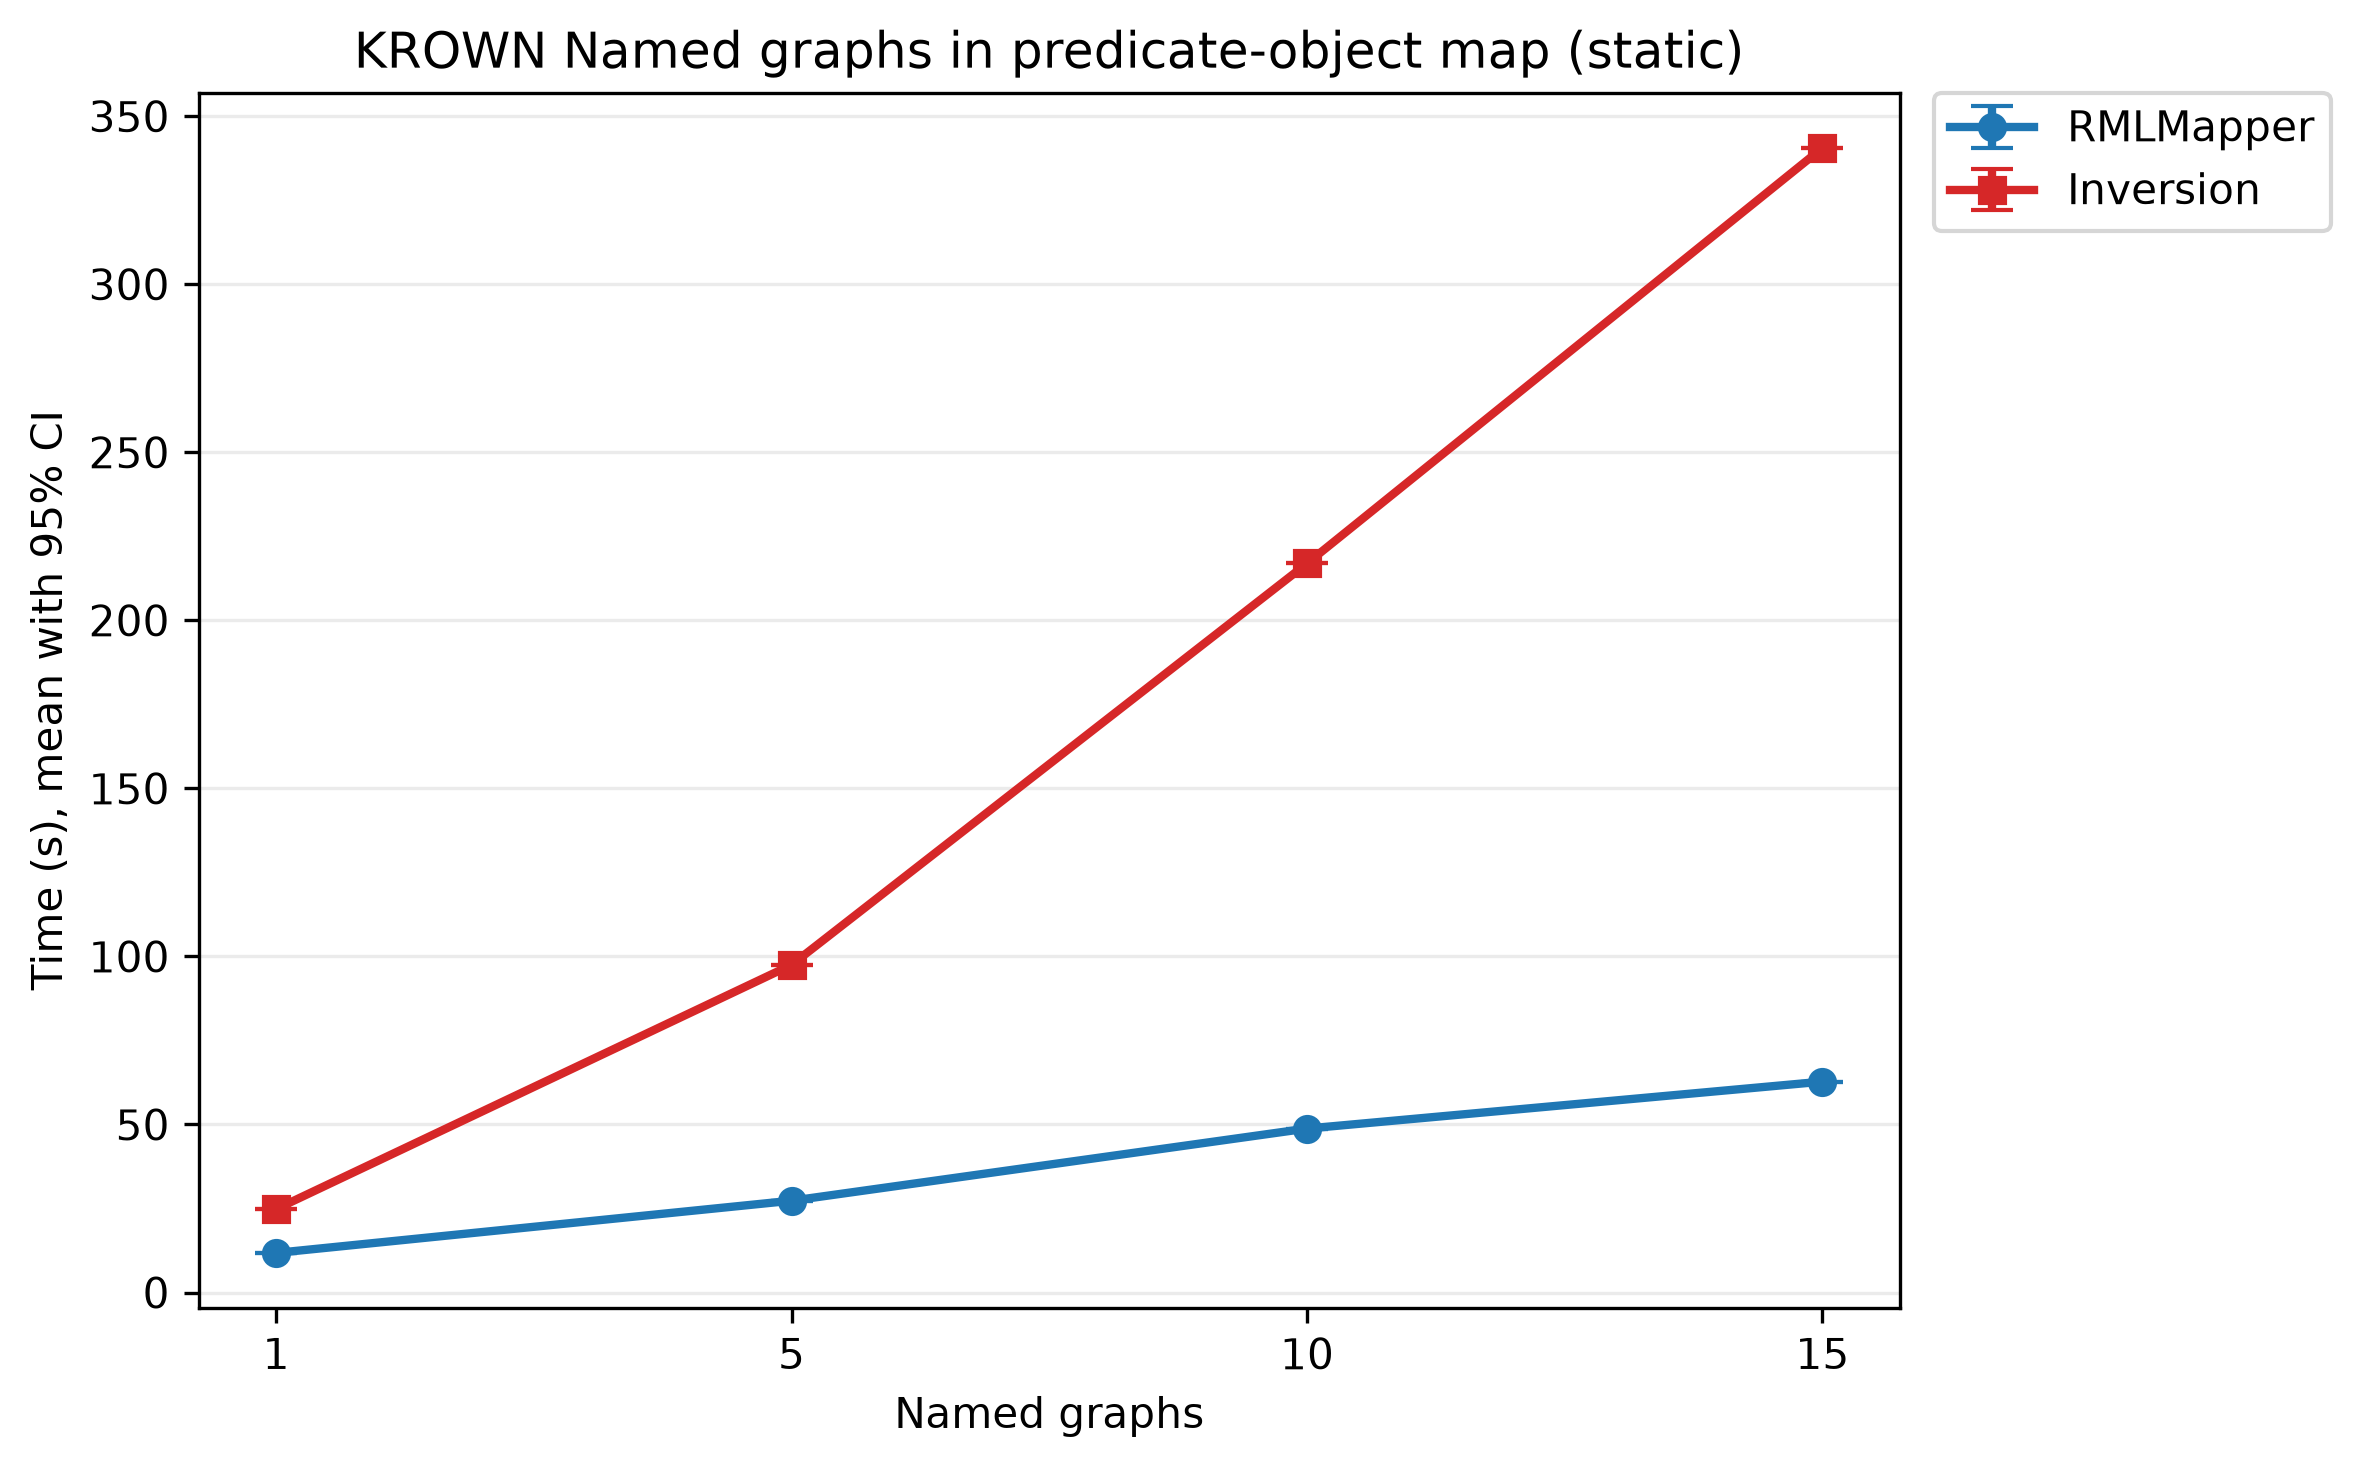
Inversion overhead is inversion time / forward time × 100. The ranges below compare the mean overhead of each completed scenario in a suite.
Suite |
Scenarios measured |
Mean overhead range |
|---|---|---|
Raw data |
8 |
48%–384% |
Mappings |
7 |
105%–318% |
Named Graphs |
20 |
124%–543% |
Joins |
13 |
0.2%–0.3% |
The joins ratio reflects the long forward phase. Mean materialization times ranged from 6,058 to 7,499 seconds, while mean inversion times ranged from 12 to 25 seconds. The resulting overhead was below 0.4% in every completed join scenario.
Raw data#
Mappings#
Named Graphs#
Joins#